LINK is at the first POIChainlink is retesting a major long-term trendline that has acted as support for nearly two years. Price has pulled back into a high-volume node, suggesting this region is where the market historically agrees on value.
Momentum is starting to stabilize after a heavy corrective phase, and multiple h

LINK USDTLINKUSDT
SPOT
Given the current market conditions, Chainlink (LINK) stands out as one of the strongest altcoins from a structural perspective. Its chart is clean, orderly, and technically one of the most attractive setups in the market right now. The price action suggests that LINK is in a smart

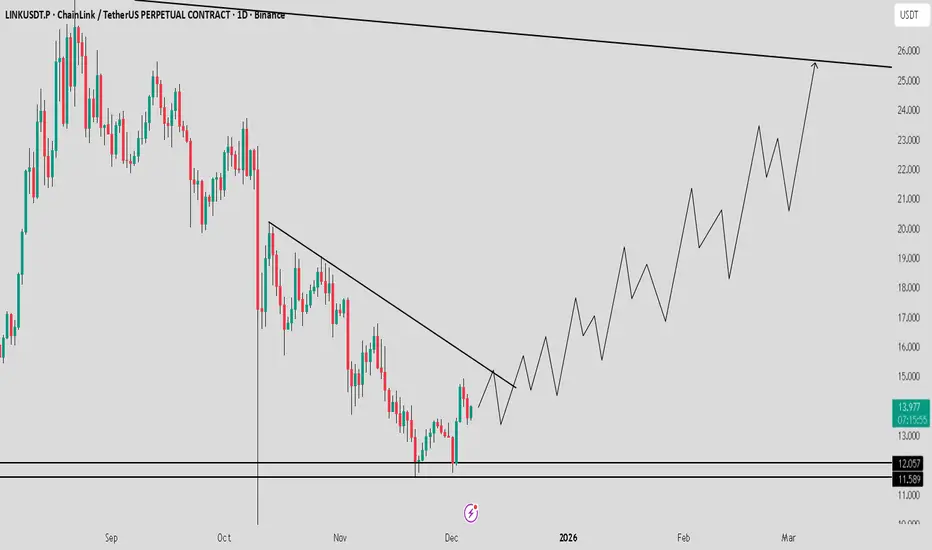
LINK Showing Strong Spot Structure_Double Bottom Point Toward 25If you want to accumulate a strong spot coin, LINK / USDT is one of the best options right now. It has formed a clean double bottom and is showing strong upward momentum. I expect a continuation move toward $25 soon. Manage risk wisely and always follow confirmations.
LINKUSDT UPDATE#LINK
UPDATE
LINK Technical Setup
Pattern: Falling Wedge Pattern
Current Price: $14.49
Target Price: $17.44
Target % Gain: 131.85%
Technical Analysis: LINK is breaking out of a falling wedge pattern on the 1D chart, signaling a bullish reversal after a prolonged downtrend. Price has compressed

LINK - BULLISH SETUP ONGOING #LINK - My H4 setup is still ongoing 📈
The current price broke above a 2+ month downtrend channel structure.
It's currently consolidating nicely, likely confirming a breakout & retest before the next big move & trend shift 📈
Big support levels:
13.30− 13.00 - $12.60
Levels to watch for a SWING

LINK/USDT — Historical Block: Bull Revival or Demand Breakdown?LINK is now approaching the most critical level of its multi-year market structure. The price has returned to the exact same demand block that triggered the major bullish expansion in previous cycles. This isn’t just support — it’s a historical liquidity zone where smart money repeatedly positioned

Chainlink (LINK) Approaching Decision ZoneSymbol: LINK USDT
Timeframe: 4H
LINK is retesting the breakout zone after reclaiming the long term descending trendline.
The market is approaching a key liquidity pocket that will decide the next wave.
Key Points:
• Price reclaimed the multi week trendline
• Consolidation happening inside a g

LINK Update🚨📊 LINK Update
LINK has formed and confirmed a Double Bottom pattern 🔄📈.
Price is now approaching the first target 🟩.
If momentum continues,
the second target at the green line level becomes likely 🎯.

LINKUSDT – Pullback Opportunity Before Next Leg Up?Chainlink (LINK) has rallied strongly but is now testing resistance, where price action could stall short-term. We're watching for a healthy pullback to reload for the next bullish wave.
🔹 Entry Zone: $12.50 – $13.50
🔹 Take Profit Levels:
• TP1: $15.50 – $16.50
• TP2: $19.00 – $21.00
• TP3: $25.00

linkusdt Double Bottom Structure BIST:LINK CRYPTOCAP:USDT
The BIST:LINK usdt pair on the 4-hour timeframe has established a bullish double bottom structure, signaling a potential trend reversal. This pattern is confirmed as the price action has broken the previous lower high (the neckline) and subsequently initiated a new mov

See all ideas
Summarizing what the indicators are suggesting.
Oscillators
Neutral
SellBuy
Strong sellStrong buy
Strong sellSellNeutralBuyStrong buy
Oscillators
Neutral
SellBuy
Strong sellStrong buy
Strong sellSellNeutralBuyStrong buy
Summary
Neutral
SellBuy
Strong sellStrong buy
Strong sellSellNeutralBuyStrong buy
Summary
Neutral
SellBuy
Strong sellStrong buy
Strong sellSellNeutralBuyStrong buy
Summary
Neutral
SellBuy
Strong sellStrong buy
Strong sellSellNeutralBuyStrong buy
Moving Averages
Neutral
SellBuy
Strong sellStrong buy
Strong sellSellNeutralBuyStrong buy
Moving Averages
Neutral
SellBuy
Strong sellStrong buy
Strong sellSellNeutralBuyStrong buy
Displays a symbol's price movements over previous years to identify recurring trends.