#LINKUSDT:minor correction first | major bullish move towards 40The LINKUSDT price is expected to decline to a range between 11.72 and 14.72 before resuming its upward trend. This price range has historically seen significant trading volume, indicating that a drop within this range is likely in the near future.
Once a trading position is initiated, there are t
Related pairs

Lingrid | LINKUSDT Follow Through Pattern FormingBINANCE:LINKUSDT price action shows continued rejection from the descending trendline inside a well-defined downward channel. The structure remains bearish, with lower highs forming under resistance near $18.00. As long as this rejection holds, price could revisit the support area toward $15.00 bef

LINK – Calm Before the Storm?Chainlink is currently consolidating within a neutral accumulation range between $15.5–18.9, showing clear volatility compression on declining volume.
The chart structure combines a downtrend channel, Fibonacci retracement, and a projected volatility cone, all converging toward a potential breakou

LINKUSDT → A trap? Grabbing liquidity before the fall...BINANCE:LINKUSDT is forming a correction after a bearish run. A false breakdown of support is triggering a correction before a possible continuation of the decline.
The coin is testing the support of the trading range within the downtrend. The reaction to the false breakdown of support is a pu

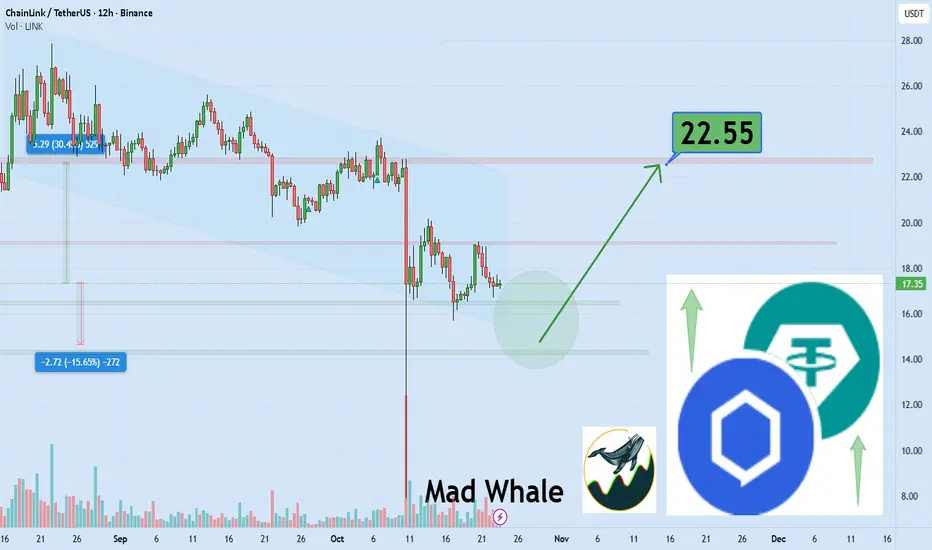
support area for link we can see upper level at least 30% gain Hi the support and resistances on the chart are based on the previous data and weekly candlesticks if BINANCE:LINKUSDT holds this last support the potential of 30% gain is logical toward 22.55$
LINK - BULLISHCRYPTOCAP:LINK - holding nicely! 📈
100$+ per tokens in 2026 still programmed!
Fundematals are too big. 💎

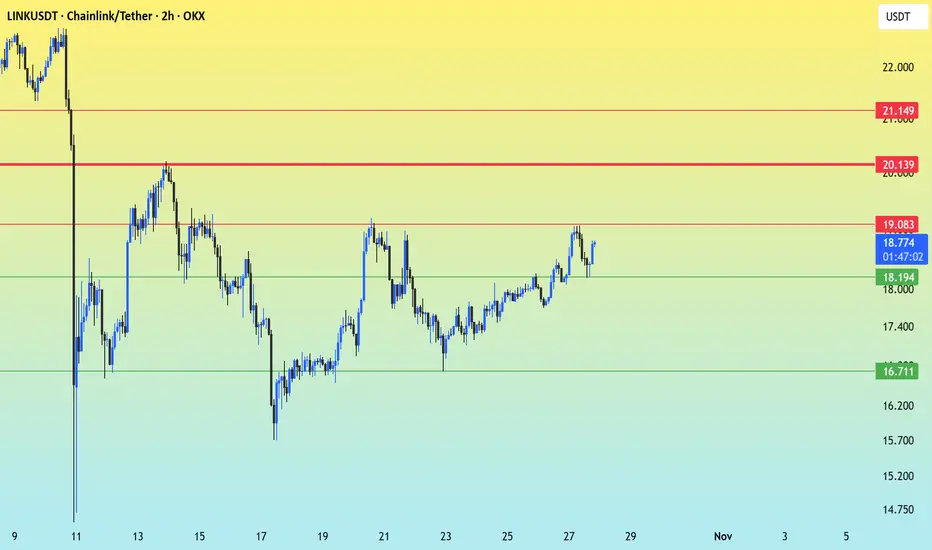
Chainlink at the Breaking Point: Is $19.08 the Gateway to $21.00LINK/USDT is in a recovery and consolidation phase after a sharp decline, currently testing the upper boundary of its range with increasing bullish pressure. Following a significant drop around October 9th-11th, the price has been in a horizontal channel, showing higher lows since the $14.75 low. It
LINK It has good growth potential in midtermWhat I see now is that the price could correct to the PRZ and then pump again, and currently, there is no specific bullish pattern in the chart. which could cause the price to drop below 13.5 dollars.
Best regards CobraVanguard.💚

Lingrid | LINKUSDT Bearish Continuation Short OpportunityBINANCE:LINKUSDT has been moving inside a well-defined downward channel, consistently forming lower highs and lower lows in line with bearish structure. The recent rejection from the downward trendline confirms continued pressure from sellers near $18.50 resistance. Unless price breaks and sustains

LINK - BULLISH SCENARIO BIST:LINK - price analysis 🍿
Almost the same PA as $DOGE.
Very neutral area on the monthly, big volatility on both side. Really hard to trade & find a direction on the short term.
A Monthly close above 18.00$ would be good for bulls regarding the tails + Kijun level ichimoku.
Bullish cons

See all ideas
Summarizing what the indicators are suggesting.
Oscillators
Neutral
SellBuy
Strong sellStrong buy
Strong sellSellNeutralBuyStrong buy
Oscillators
Neutral
SellBuy
Strong sellStrong buy
Strong sellSellNeutralBuyStrong buy
Summary
Neutral
SellBuy
Strong sellStrong buy
Strong sellSellNeutralBuyStrong buy
Summary
Neutral
SellBuy
Strong sellStrong buy
Strong sellSellNeutralBuyStrong buy
Summary
Neutral
SellBuy
Strong sellStrong buy
Strong sellSellNeutralBuyStrong buy
Moving Averages
Neutral
SellBuy
Strong sellStrong buy
Strong sellSellNeutralBuyStrong buy
Moving Averages
Neutral
SellBuy
Strong sellStrong buy
Strong sellSellNeutralBuyStrong buy
Displays a symbol's price movements over previous years to identify recurring trends.
Frequently Asked Questions
The current price of ChainLink / TetherUS (LINK) is 15.19 USDT — it has fallen −8.53% in the past 24 hours. Try placing this info into the context by checking out what coins are also gaining and losing at the moment and seeing LINK price chart.
ChainLink / TetherUS price has fallen by −13.21% over the last week, its month performance shows a −28.49% decrease, and as for the last year, ChainLink / TetherUS has increased by 35.75%. See more dynamics on LINK price chart.
Keep track of coins' changes with our Crypto Coins Heatmap.
Keep track of coins' changes with our Crypto Coins Heatmap.
ChainLink / TetherUS (LINK) reached its highest price on May 10, 2021 — it amounted to 53.00 USDT. Find more insights on the LINK price chart.
See the list of crypto gainers and choose what best fits your strategy.
See the list of crypto gainers and choose what best fits your strategy.
ChainLink / TetherUS (LINK) reached the lowest price of 0.35 USDT on Jan 28, 2019. View more ChainLink / TetherUS dynamics on the price chart.
See the list of crypto losers to find unexpected opportunities.
See the list of crypto losers to find unexpected opportunities.
The safest choice when buying LINK is to go to a well-known crypto exchange. Some of the popular names are Binance, Coinbase, Kraken. But you'll have to find a reliable broker and create an account first. You can trade LINK right from TradingView charts — just choose a broker and connect to your account.
Crypto markets are famous for their volatility, so one should study all the available stats before adding crypto assets to their portfolio. Very often it's technical analysis that comes in handy. We prepared technical ratings for ChainLink / TetherUS (LINK): today its technical analysis shows the strong sell signal, and according to the 1 week rating LINK shows the sell signal. And you'd better dig deeper and study 1 month rating too — it's sell. Find inspiration in ChainLink / TetherUS trading ideas and keep track of what's moving crypto markets with our crypto news feed.
ChainLink / TetherUS (LINK) is just as reliable as any other crypto asset — this corner of the world market is highly volatile. Today, for instance, ChainLink / TetherUS is estimated as 21.71% volatile. The only thing it means is that you must prepare and examine all available information before making a decision. And if you're not sure about ChainLink / TetherUS, you can find more inspiration in our curated watchlists.
You can discuss ChainLink / TetherUS (LINK) with other users in our public chats, Minds or in the comments to Ideas.