LINK USDT LONG SIGNAL---
📢 Official Trade Signal – LINK/USDT
📈 Position Type: LONG
💰 Entry Price: 14.064
Entry price=2
13.756
---
🎯 Take-Profit Targets (Partial Exits):
• TP1: 14.294
• TP2: 14.515
• TP3: 14.740
• TP4: 14.976
• TP5: 15.316
• TP6: 15.660
---
🛑 Stop-Loss: 13.355
📊 Timeframe: 15m
⚖️ Risk/Reward Ratio: ≈ 2.03 (based on TP6)
💥 Suggested Leverage: 5× – 10×
---
🧠 Technical Analysis Summary
LINK is showing signs of bullish momentum after holding above the key support level around 14.064. The market structure on the 15-minute chart suggests a potential upward move, with higher lows forming and price testing immediate resistance zones. The take-profit levels are aligned with previous swing highs and liquidity concentrations on the higher timeframes.
The critical upside targets are:
14.294 → 14.515 → 14.740 → 14.976 → 15.316 → 15.660
A confirmed break above TP1 (14.294) may accelerate momentum toward the subsequent targets, especially if supported by increasing volume and bullish market sentiment.
---
⚙️ Trade Management Rules
✔ Take partial profit at each TP level
✔ Move stop-loss to entry point once TP1 is reached
✔ Trail stop-loss upward as price advances
✔ No re-entry if stop-loss (13.872) is triggered
✔ Confirm bullish structure and momentum before entering
---
📌 TradingView Hashtags
#LINKUSDT #LINK #CryptoSignal #LongSetup
#TradingView #FuturesTrading #TechnicalAnalysis
---
Disclaimer: Always practice proper risk management and verify market conditions before entering any trade.
Trade ideas

LINK USDTLINKUSDT
SPOT
Given the current market conditions, Chainlink (LINK) stands out as one of the strongest altcoins from a structural perspective. Its chart is clean, orderly, and technically one of the most attractive setups in the market right now. The price action suggests that LINK is in a smart accumulation phase, with consistent buyer interest showing up every time price tests key support levels.
This structure indicates that market makers are actively building a multi-layered base, and if LINK manages to break through its major resistance zone, the asset has the potential to trigger a strong upward move and shift the entire mid-term trend.
Even though my drawing on the chart isn’t perfect, the analytical logic behind the structure is accurate. LINK is showing a pattern that often appears before a directional expansion — a controlled pullback followed by a steady, measured climb, similar to a well-structured channel or trendline extension.
In summary:
LINK is one of the few altcoins with a technically healthy setup, and with a minor correction followed by a breakout, it could enter a meaningful bullish phase.

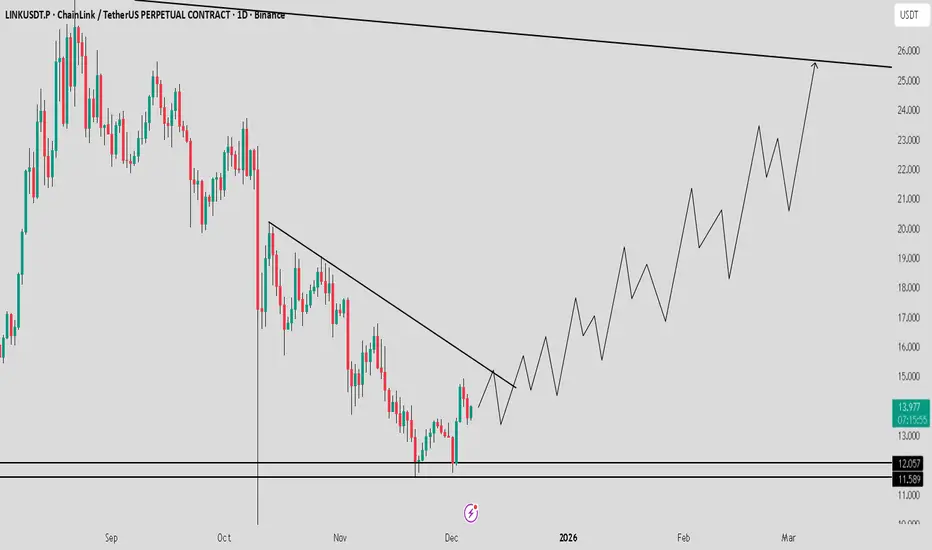
LINK Showing Strong Spot Structure_Double Bottom Point Toward 25If you want to accumulate a strong spot coin, LINK / USDT is one of the best options right now. It has formed a clean double bottom and is showing strong upward momentum. I expect a continuation move toward $25 soon. Manage risk wisely and always follow confirmations.
linkusdt Double Bottom Structure BIST:LINK CRYPTOCAP:USDT
The BIST:LINK usdt pair on the 4-hour timeframe has established a bullish double bottom structure, signaling a potential trend reversal. This pattern is confirmed as the price action has broken the previous lower high (the neckline) and subsequently initiated a new move toward a higher high, indicating a shift in market structure from bearish to bullish
⚠️ Disclaimer:
This setup is shared for educational purposes only. It is not financial advice. Always do your own analysis and apply proper risk management before trading any setup

LINK - BULLISH SETUP ONGOING #LINK - My H4 setup is still ongoing 📈
The current price broke above a 2+ month downtrend channel structure.
It's currently consolidating nicely, likely confirming a breakout & retest before the next big move & trend shift 📈
Big support levels:
13.30− 13.00 - $12.60
Levels to watch for a SWING play:
🎯 $ 14.80
🎯 $ 15.40
🎯 $ 15.80
🎯 $ 16.50
🎯 $17.00
Not financial advice. Educational TA only. DYOR & trade at your own risk.

Chainlink (LINK) Approaching Decision ZoneSymbol: LINK USDT
Timeframe: 4H
LINK is retesting the breakout zone after reclaiming the long term descending trendline.
The market is approaching a key liquidity pocket that will decide the next wave.
Key Points:
• Price reclaimed the multi week trendline
• Consolidation happening inside a golden retrace region
• Breakout retest structure gives a cleaner bullish continuation setup
• Fibonacci 0.5 to 0.786 cluster acting as the main decision zone
Bullish Scenario:
If LINK holds the 12.3 to 12.8 support box and confirms a higher low
then a push toward 14.92 and 17.65 becomes highly probable.
Momentum favours a continuation if buyers step in at the retest.
Bearish Scenario:
Failure of the support box opens the door to 12.29 and even
11.60 where the next liquidity pocket is waiting.
What I am watching:
• Stability above 13.5
• Reaction at the trendline retest
• Volume confirmation on bounce

LINK/USDT — Historical Block: Bull Revival or Demand Breakdown?LINK is now approaching the most critical level of its multi-year market structure. The price has returned to the exact same demand block that triggered the major bullish expansion in previous cycles. This isn’t just support — it’s a historical liquidity zone where smart money repeatedly positioned itself before every significant rally.
And once again, the market is testing this area.
---
**✨ Market Narrative:
“Back to Where the Trend Began”**
From 2023 to 2025, every approach to the $10–$8.8 zone resulted in heavy absorption, long wicks, and strong reversals. This proves that this area acts as a primary liquidity pool for institutional accumulation.
This current revisit could become:
A bullish revival into a new multi-month uptrend,
or
A full breakdown into deeper distribution if the zone fails.
Simply put:
👉 This is LINK’s “make or break” level.
---
📈 Bullish Scenario — “Demand Awakening”
The bullish thesis activates if price:
Holds above $10–$8.8,
Forms a new higher low,
And closes strongly above $13–$14 on the 4D timeframe.
Signs of accumulation:
Long downside wicks inside the block
Increasing volume after compression
Higher timeframe candle reclaiming previous breakdown points
If confirmed, upside targets unfold naturally:
🎯 Target 1: $15–$17
🎯 Target 2: $21–$26
🎯 Target 3: Retest of the 2024 macro highs (expansion phase)
A reclaim of $17 would signal that the macro bullish trend is re-establishing itself.
---
📉 Bearish Scenario — “Demand Collapse”
The bearish thesis confirms ONLY when price:
Prints a decisive 4D close below $8.8,
Followed by continuation (not just a liquidity wick).
If the demand block breaks, the market shifts from accumulation to full distribution.
Downside targets become likely:
🎯 Target 1: $6–$5
🎯 Target 2: $4.7 (historical low & liquidity magnet)
🎯 Target 3: Full macro range retracement
This breakdown would represent a structural trend shift on the higher timeframe.
---
📊 Pattern & Market Structure Breakdown
Historical Demand Revisit: Price has returned to the core area that defined the previous rally.
Liquidity Grab Evidence: Deep wicks below the block — classic stop hunts before accumulation.
Macro Range Structure: LINK remains inside a multi-year range, hovering at its lower boundary.
Trend Context: Lower highs formed in 2025, and now price is searching for macro direction.
This isn’t ordinary price action —
this is where accumulation and distribution collide.
#LINK #Chainlink #Crypto #Altcoins #TechnicalAnalysis #DemandZone #PriceAction #MarketStructure #SmartMoney #CryptoAnalysis #SupportResistance

LINK is at the first POIChainlink is retesting a major long-term trendline that has acted as support for nearly two years. Price has pulled back into a high-volume node, suggesting this region is where the market historically agrees on value.
Momentum is starting to stabilize after a heavy corrective phase, and multiple higher-timeframe oscillators are showing early signs of exhaustion from sellers. As long as LINK holds this structural base, the setup favors a potential rebound back into the mid-range.
However, losing this support would open the door to the next volume pocket lower, where liquidity becomes thin and volatility increases.
This is a key moment for LINK: hold the trendline and re-enter the range, or break down and revisit the lower demand zone.

LINKUSDT – Pullback Opportunity Before Next Leg Up?Chainlink (LINK) has rallied strongly but is now testing resistance, where price action could stall short-term. We're watching for a healthy pullback to reload for the next bullish wave.
🔹 Entry Zone: $12.50 – $13.50
🔹 Take Profit Levels:
• TP1: $15.50 – $16.50
• TP2: $19.00 – $21.00
• TP3: $25.00 – $28.00
🔹 Stop Loss: $11.90
Key Idea: A rejection at current resistance could offer a better long entry. If price dips into the $12.50–$13.50 zone and shows strength, it may kick off the next upward move.
📌 Watching for bullish confirmation in that range. Chart structure still favors upside as long as $11.90 holds.

LINK/USDT ENTRY:13.66 _ 13.28
SL:13.14
TP:14.66
There is a possibility of price growth.
**Please respect capital management. There is no responsibility for your profits or losses.**

$LINKUSDT — This $12.80–$12.50 Pivot Could Send LINK Vertical!BINANCE:LINKUSDT is forming a clean bullish structure after both a major and minor CHOCH, supported by repeated BOS signals. Price is now pulling into the $12.80–$12.50 advanced order block, which is the key demand zone to watch for a potential long entry.
If buyers step in and the zone holds, upside targets remain $13.40, $13.90, and $14.60.
A breakdown below $12.20 invalidates the setup and opens the door for deeper downside.
This order block will determine whether LINK continues its developing bullish momentum. Stay patient and manage your risk.

LINKUSDT Chart Analysis 3-Dec-25Stop Loss:11.60
Buy Stop:14.26
Take Profit 1: 16.16
Take Profit 2:18.50
(Symmetrical Triangle) has formed in this chart according to pattern it can hit the tps.
⚠️ Always remember to protect your capital with a proper stop-loss and disciplined risk management.

Chainlink (LINK): Risking 33% To Gain 150% | Worth The RiskLINK has been moving in clear waves for years — strong expansions up, followed by deep corrections down, and the pattern repeats almost identically every cycle. The zones highlighted on the chart show this behaviour perfectly: every major downside wave was followed by a strong recovery phase once sellers were exhausted.
Right now we’ve just completed another heavy downside leg, and the depth of this correction is very similar to previous cycle bottoms. That’s why this area stands out as a spot where the correction might be ending, or at least cooling off enough to give a high-probability long setup. If buyers manage to hold above the recent low and shift momentum, the next upside leg could mirror the previous expansions — which were all strong and clean moves.
The R:R here is worth the risk — same logic as every previous reversal cycle on LINK. Let buyers show some continuation and we’ll look to ride the next wave.
Swallwo Academy

ChainLink LINK price analysis#LINK is literally standing on the edge…
Right now the price is hanging by a thread:
⚠️ a daily close below $11.50 is highly undesirable — this could open the door to a much deeper drop.
🕒 On the 3D timeframe, the OKX:LINKUSDT chart looks extremely intriguing.
Where do you see #LINK six months from now?
➡️ A push toward $53
or
⬅️ A slide into the $5.50–7.00 zone?
📊 Current #Chainlink market cap: $8B.
Hypothetically, in six months it could be either:
🔻 $4–5B, if the market keeps pressing lower
or
🔺 $37B, if the trend flips and demand flows back in.
❓ What scenario are you leaning toward? A long-term rebound or a deeper liquidity sweep first?
______________
◆ Follow us ❤️ for daily crypto insights & updates!
🚀 Don’t miss out on important market moves
🧠 DYOR | This is not financial advice, just thinking out loud

LINK Showing Strength at Long-Term Support ZoneBIST:LINK is bouncing cleanly from its long-term weekly trendline support, keeping the bullish structure intact.
Price is still moving inside a large wedge, and if this rebound continues, a retest of the upper resistance line is likely.
A breakout above that level could open the door for a stronger move.
DYOR, NFA
Please hit the like button if you like it, and share your views in the comments section.

LINKUSDT: Rejection Zone Ahead LINK is climbing into the $13.8–$14.0 supply zone, where strong distribution and repeated bearish structure breaks suggest sellers are ready to step back in. A clean rejection here could drive price toward the $13, $12.50, and $12 downside targets.
This area is key for confirming continuation of the broader bearish trend. Trade safely and manage your risk.
For more analysis, like and comment.
#LINK #LINKUSDT #CryptoAnalysis #CryptoCharts #Altcoins #TradingSetup #BearishSetup

LINKUSDT UPDATE#LINK
UPDATE
LINK Technical Setup
Pattern: Falling Wedge Pattern
Current Price: $14.49
Target Price: $17.44
Target % Gain: 131.85%
Technical Analysis: LINK is breaking out of a falling wedge pattern on the 1D chart, signaling a bullish reversal after a prolonged downtrend. Price has compressed within the wedge structure and is now pushing above the descending resistance trendline, indicating increasing buying pressure. The breakout structure suggests a potential continuation move toward the projected target zone, provided price maintains strength above the breakout area and holds key support levels.
Time Frame: 1D
Risk Management Tip: Always use proper risk management.

LINK Update🚨📊 LINK Update
LINK has formed and confirmed a Double Bottom pattern 🔄📈.
Price is now approaching the first target 🟩.
If momentum continues,
the second target at the green line level becomes likely 🎯.

LINK NEXT TARGET#LINK is completing a clean harmonic reversal pattern on the 4D timeframe — with price sitting exactly at point A, a key demand zone and structural support🔥📈
BIST:LINK If this harmonic plays out, we should see a multi-leg expansion toward:
🎯 Point B → 0.473 ratio
🎯 Point C → 0.484 completion
🎯 Point D → 1.244 – 4.373 extension zone (major breakout targets)

LINK/USDT: Bearish Bias Holds Below 14.00 Resistance ConfluenceLINK/USDT respected prior analysis, advancing into the 14.00 resistance zone, where the descending trendline and former structure highs intersect. Price is forming a corrective pullback after a recent lower low, while momentum fades. The broader downward channel remains intact, reinforcing the bearish outlook.
As long as sellers defend 14.00, the pair is likely to extend toward the 11.75 liquidity pocket, aligning with the established trend of rejections and lower lows.
➡️ Primary view: Rejection from 14.00 → move toward 11.75
❗️ Risk: Breakout above the channel would invalidate bearish structure.

LINK - PRICE ANALYSIS CRYPTOCAP:LINK - price analysis:
I checked all TF: the current price is stuck between the 14.30 & 12.60$ on the daily basis.
Momentum remain bearish HTF but the short term price action & strutcture looks better.
Long term channel still valid & the price is likely consolidating on the main uptrend again. 📈
Weekly level to be maintained: 12.30$
No real price direction on the higher time frame as there are still many big resistances ahead.

Lingrid | LINKUSDT Pullback Then Bearish ContinuationBINANCE:LINKUSDT perfectly played out my previous trading idea . Price is approaching the 14.00 resistance band, a zone where the downward trendline and previous structural ceiling intersect. The pair is forming a corrective pullback into this confluence after its recent lower-low formation, and momentum is already showing signs of fading. Price remains inside the broader downward channel, keeping the higher-timeframe bias firmly bearish despite short-term relief rallies.
If sellers maintain pressure below 14.00, it is positioned for a continuation move toward the deeper liquidity pocket sitting near 11.75. This aligns with the broader trend structure, where repeated bearish extensions have followed each rejection at the descending trendline.
➡️ Primary scenario: rejection holds → continuation toward 11.75.
⚠️ Risk scenario: a breakout and close above channel would invalidate the bearish setup.
If this idea resonates with you or you have your own opinion, traders, hit the comments. I’m excited to read your thoughts!

LINK at Critical Bounce Point, Historically Where Rallies BeginBIST:LINK is back inside one of the strongest accumulation zones on the chart.
This trendline has held for almost 5 years, and every touch has led to a major move up.
Price is now sitting right on support and the 0.618/0.786 Fib levels a zone where smart money usually loads.
If LINK holds here, a push back toward $17–$21 is on the table.
This is the area where big moves often start.
