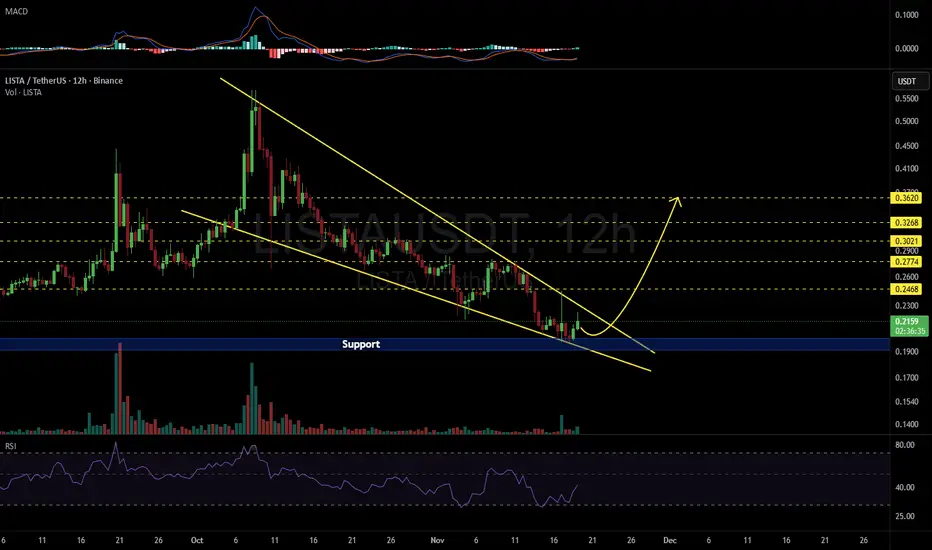
LISTAUSDT 12H#LISTA has formed a falling wedge pattern on the 12H timeframe. Consider buying a small bag here and another near the support in case of a deeper dip. If the price breaks out above the pattern resistance, the potential upside targets are:
🎯 $0.2468
🎯 $0.2774
🎯 $0.3021
🎯 $0.3268
🎯 $0.3620
⚠️ Always
$lista ready to fly?Lista DAO’s 3.65% 24-hour price rise appears driven by a major exchange listing, bullish technical momentum, and strategic ecosystem developments.
Bithumb listing (24 July) boosted accessibility for South Korean traders.
Technical indicators show bullish momentum above key moving averages.
Partne
LISTA - 100% UP!!! 🔥🔥🔥My medium term outlook are game changing for my followers! 🔥🔥🔥
#LISTA - 29/08 vs today🤑
100% UP 💥 = 500+ Like for this one! 👍


#LISTA/USDT#LISTA
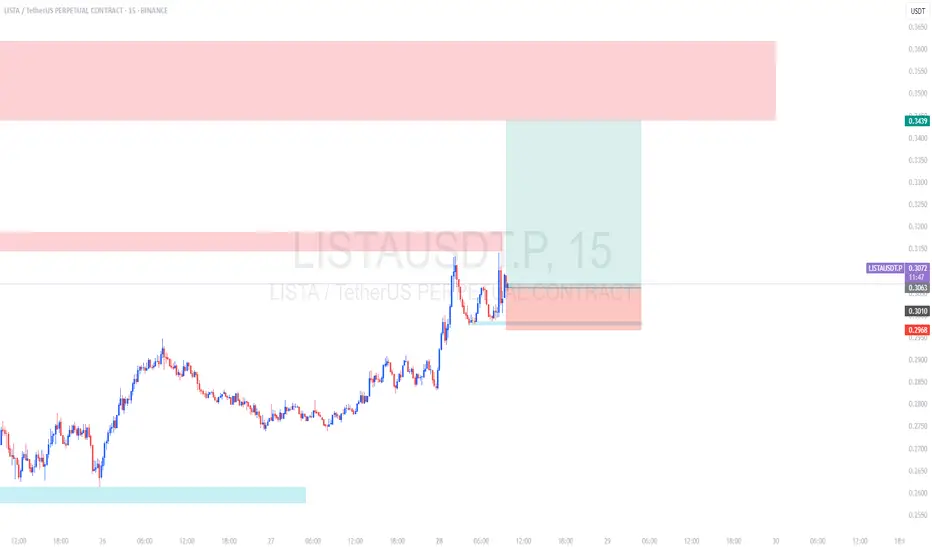
The price is moving within a descending channel on the 1-hour frame, adhering well to it, and is heading for a strong breakout and retest.
We are seeing a bounce from the lower boundary of the descending channel, which is support at 0.1970.
We have a downtrend on the RSI indicator that is a

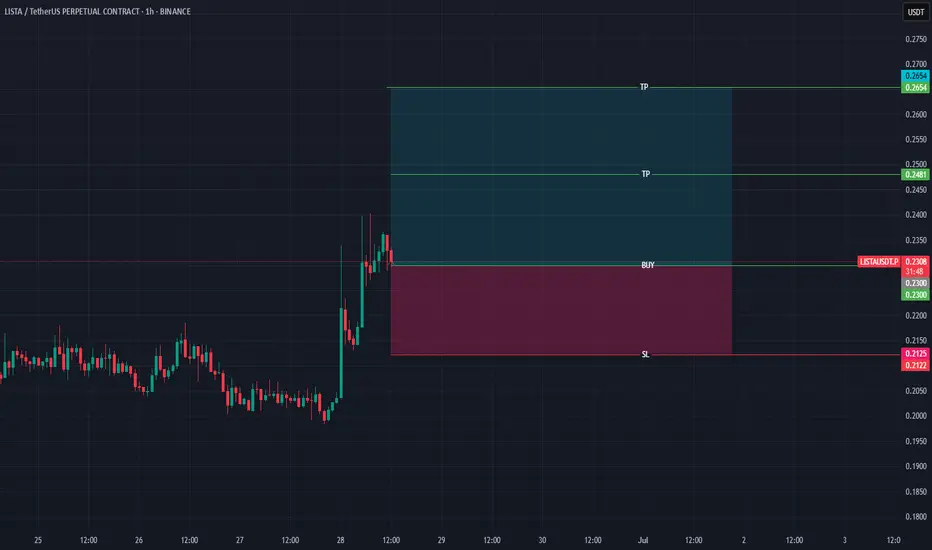
LISTAUSDT Forming Falling WedgeLISTAUSDT is setting up a promising technical scenario with its clear falling wedge pattern, a structure known for signaling bullish reversals after a period of consolidation. The wedge is narrowing nicely, suggesting that selling momentum is weakening while buying pressure is starting to build. Wit

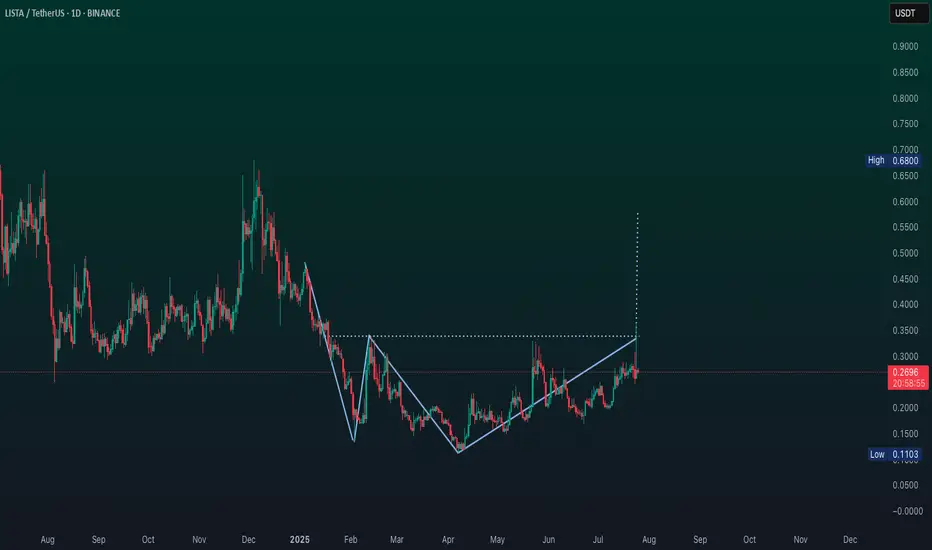
Lista DAO: 100% & 346% TargetsAnother interesting chart here, the candles might seen small but LISTAUSDT produced more than 200% between April and May, and it is ready to move again.
The action is happening now as a strong higher low and buy-volume has been really hiiiiigh lately going up, up, up. This type of chart supports a

See all ideas
Summarizing what the indicators are suggesting.
Oscillators
Neutral
SellBuy
Strong sellStrong buy
Strong sellSellNeutralBuyStrong buy
Oscillators
Neutral
SellBuy
Strong sellStrong buy
Strong sellSellNeutralBuyStrong buy
Summary
Neutral
SellBuy
Strong sellStrong buy
Strong sellSellNeutralBuyStrong buy
Summary
Neutral
SellBuy
Strong sellStrong buy
Strong sellSellNeutralBuyStrong buy
Summary
Neutral
SellBuy
Strong sellStrong buy
Strong sellSellNeutralBuyStrong buy
Moving Averages
Neutral
SellBuy
Strong sellStrong buy
Strong sellSellNeutralBuyStrong buy
Moving Averages
Neutral
SellBuy
Strong sellStrong buy
Strong sellSellNeutralBuyStrong buy
Displays a symbol's price movements over previous years to identify recurring trends.