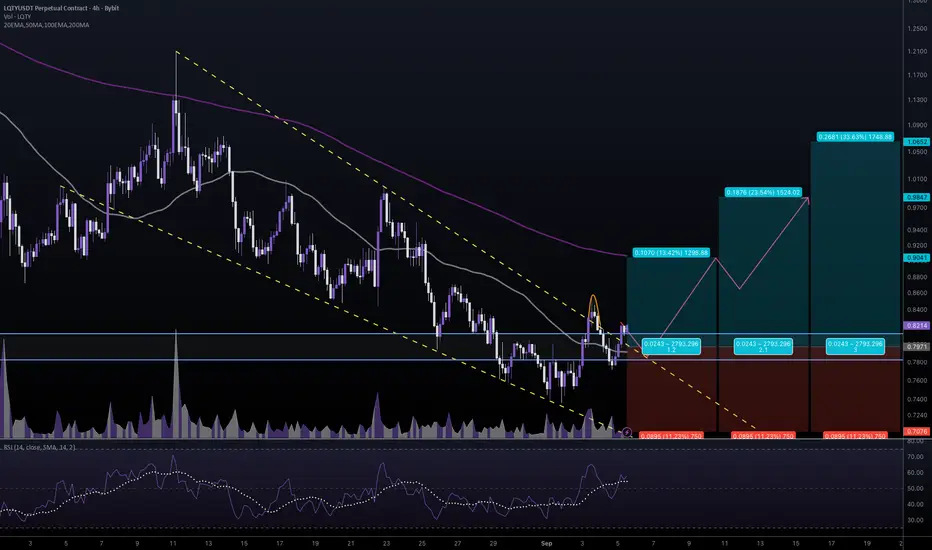
LQTYUSDT Breaks a downtrend in a bearish market...So LQTY just broke a 4 months downtrend in a bear market where almost all other USDT pairs are bleeding.
That tells there is very good momentum that could drive the price higher to the marked targets.
Good Luck!

LQTYUSDT – Descending Triangle Breakdown Opens the Door to LowerThe weekly chart shows a clear descending triangle formation, characterized by a series of lower highs pressing toward a flat horizontal support zone. This type of structure is typically considered a bearish continuation pattern, reflecting consistent selling pressure.
Recently, price has broken

LQTYUSDT Breaks a downtrend in a bearish market...So LQTY just broke a 4 months downtrend in a bear market where almost all other USDT pairs are bleeding.
That tells there is very good momentum that could drive the price higher to the marked targets.
Good Luck!

LQTYUSDT 1D#LQTY daily chart looks promising. RSI and MACD are showing potential bullish momentum. Price has broken above the daily SMA50 and the Ichimoku cloud, but the daily candle hasn’t closed yet. Volume has increased and price has reached the descending resistance. The structure is bullish. In case of a


LQTYUSDT 1D#LQTY is moving toward the descending resistance on the daily chart, with a noticeable increase in trading volume. In case of a breakout above the daily SMA50 and the descending resistance, the potential upside targets are:
🎯 $0.667
🎯 $0.790
🎯 $0.890
🎯 $0.989
🎯 $1.130
🎯 $1.310
⚠️ Always remember t

LQTYUSDT UPDATE#LQTY
UPDATE
LQTY Technical Setup
Pattern: Bullish Falling Wedge
Current Price: $0.530
Target Price: $1.118
Target % Gain: 100.46%
$LQTY is breaking out of a bullish falling wedge pattern on the 1D timeframe. The current price is $0.530 with a projected target near $1.118, offering around 100% po

LQTY$LQTY is trading within a descending channel pattern, showing strong potential for a bullish reversal. A confirmed breakout from the upper trendline could lead to an estimated 400% upside from the current price, supported by improving momentum indicators.

$LQTY - price keep consolidating above main support & trend test
$LQTY - price keep consolidating above main support & trend test HTF 📈
Looks good!📈

#LQTYUSDT #4h (Bitget Futures) Faling wedge breakout and retestLiquity just regained 50MA support after a first deviation, seems likely to resume bullish towards 200MA resistance and more.
⚡️⚡️ #LQTY/USDT ⚡️⚡️
Exchanges: Bitget Futures
Signal Type: Regular (Long)
Leverage: Isolated (4.0X)
Amount: 4.5%
Current Price:
0.8214
Entry Zone:
0.8116 - 0.7826
Take-P
See all ideas
Summarizing what the indicators are suggesting.
Oscillators
Neutral
SellBuy
Strong sellStrong buy
Strong sellSellNeutralBuyStrong buy
Oscillators
Neutral
SellBuy
Strong sellStrong buy
Strong sellSellNeutralBuyStrong buy
Summary
Neutral
SellBuy
Strong sellStrong buy
Strong sellSellNeutralBuyStrong buy
Summary
Neutral
SellBuy
Strong sellStrong buy
Strong sellSellNeutralBuyStrong buy
Summary
Neutral
SellBuy
Strong sellStrong buy
Strong sellSellNeutralBuyStrong buy
Moving Averages
Neutral
SellBuy
Strong sellStrong buy
Strong sellSellNeutralBuyStrong buy
Moving Averages
Neutral
SellBuy
Strong sellStrong buy
Strong sellSellNeutralBuyStrong buy
Displays a symbol's price movements over previous years to identify recurring trends.