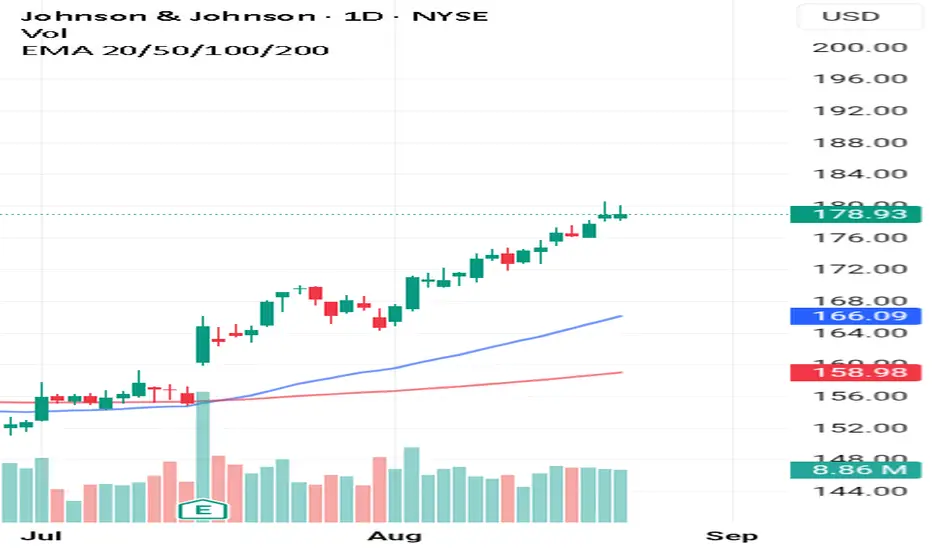
JNJ watch $180: Took profits at Serious Resistance that may DIP Caught a PERFECT long now closed (see Idea below)
Now at a serious resistance zone $179.49-180.05
Look for Dip-to-Fib or Break-n-Retest for next move.
.
Previous Analysis that caught the EXACT BREAKOUT:
Hit BOOST and FOLLOW for more such PRECISE and TIMELY charts.
===============================
Next report date
—
Report period
—
EPS estimate
—
Revenue estimate
—
9.4 USD
14.07 B USD
88.82 B USD
2.41 B
About Johnson & Johnson
Sector
Industry
CEO
Joaquin Duato
Website
Headquarters
New Brunswick
Founded
1887
FIGI
BBG00QKLW2K1
Johnson & Johnson is a holding company, which engages in the research, development, manufacture, and sale of products in the healthcare field. It operates through the Innovative Medicine and MedTech segments. The Innovative Medicine segment focuses on immunology, infectious diseases, neuroscience, oncology, cardiovascular and metabolism, and pulmonary hypertension. The MedTech segment includes a portfolio of products used in the interventional solutions, orthopaedics, surgery, and vision categories. The company was founded by Robert Wood Johnson I, James Wood Johnson, and Edward Mead Johnson Sr. in 1887 and is headquartered in New Brunswick, NJ.
Related stocks

JNJ watch $156.72-158.17: Double Golden Fib zone about to break?JNJ struggling against Double Goldens at $156.72-158.17
After many tests from underside, it looks ready to break.
Above this zone are only scattered clouds for some ways.

Do These 4 Steps To Understand A Short Squeeze MindsetYou believe trading the new high is very hard.You have have heard of pump and dump.This is when someone promotes
A stock price and "wham!" The stock crashes on you.
Maybe you tried using the ADX or DMI indicator and you lost your marbles or mind trying to catch the trend.
Yesterday I felt like a
JNJ AUG - 2025Johnson & Johnson ( NYSE:JNJ ) continues its bullish structure, holding above the 170 support zone with institutional absorption visible in recent candles. Price is approaching upper channel resistance, with momentum pointing toward 185 as the next target if trend strength holds.
Key supports remai

Johnson & Johnson Wave Analysis – 11 August 2025- Johnson & Johnson broke the resistance level 168.15
- Likely to rise to level 175.95
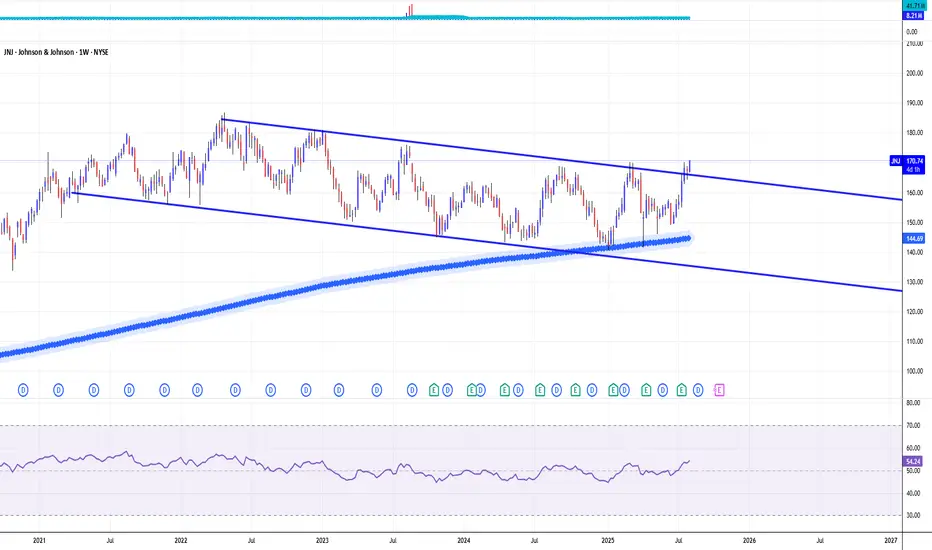
Johnson & Johnson previously broke the resistance level 168.15 (upper border of the weekly sideways price range inside which the price has been trading from 2023).
The breakout of the resistance level 168.15 acc

Johnson & Johnson. Clean. Soft. Gentle. Growth.Johnson & Johnson (JNJ) stands out as a bellwether in the global healthcare sector, and its nearly 18% stock performance in 2025 reflects both robust fundamentals and compelling technical trends.
Fundamental Perspective
JNJ maintains a solid financial foundation, underpinned by consistently st
Johnson & Johnson | JNJ | Long at $146.00Johnson & Johnson NYSE:JNJ is strong (but highly controversial) company with anticipated earnings growth on the horizon. With a P/E of 23x, steady dividend growth record, low debt, and expected increased cashflow, the future is optimistic for NYSE:JNJ if they can stay out of the shady spotlight.

Johnson & Johnson Wave Analysis – 31 July 2025 Johnson & Johnson reversed from the resistance zone
- Likely to fall to support level 160.00
Johnson & Johnson recently reversed down from the strong resistance zone located between the long-term resistance level 168.15 (upper border of the weekly sideways price range from 2023) and the upper week

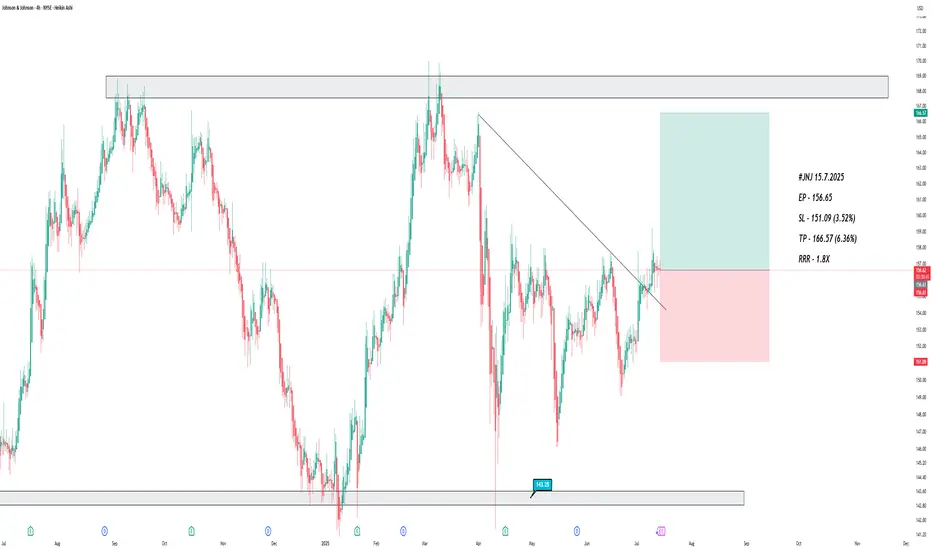
JOHNSON & JOHNSON Sell opportunity on a Double Resistance.It's been 9 months (October 11 2024, see chart below) since our last Johnson & Johnson (JNJ) analysis, where we gave a very timely sell signal that surgically hit our $141.00 Target:
The Channel Down has since broke to the upside and a new Higher Lows structure has emerged but with a clear Resi

See all ideas
Summarizing what the indicators are suggesting.
Neutral
SellBuy
Strong sellStrong buy
Strong sellSellNeutralBuyStrong buy
Neutral
SellBuy
Strong sellStrong buy
Strong sellSellNeutralBuyStrong buy
Neutral
SellBuy
Strong sellStrong buy
Strong sellSellNeutralBuyStrong buy
An aggregate view of professional's ratings.
Neutral
SellBuy
Strong sellStrong buy
Strong sellSellNeutralBuyStrong buy
Neutral
SellBuy
Strong sellStrong buy
Strong sellSellNeutralBuyStrong buy
Neutral
SellBuy
Strong sellStrong buy
Strong sellSellNeutralBuyStrong buy
Displays a symbol's price movements over previous years to identify recurring trends.
JNJ6008933
Johnson & Johnson 4.5% 01-MAR-2027Yield to maturity
—
Maturity date
Mar 1, 2027
JNJ5033705
Johnson & Johnson 0.55% 01-SEP-2025Yield to maturity
—
Maturity date
Sep 1, 2025
JNJ5033707
Johnson & Johnson 1.3% 01-SEP-2030Yield to maturity
—
Maturity date
Sep 1, 2030
JNJ6009544
Johnson & Johnson 4.85% 01-MAR-2032Yield to maturity
—
Maturity date
Mar 1, 2032
JNJ.GT
Johnson & Johnson 4.5% 01-SEP-2040Yield to maturity
—
Maturity date
Sep 1, 2040
JNJ6009545
Johnson & Johnson 5.0% 01-MAR-2035Yield to maturity
—
Maturity date
Mar 1, 2035
JNJ6009543
Johnson & Johnson 4.7% 01-MAR-2030Yield to maturity
—
Maturity date
Mar 1, 2030
JNJ5033706
Johnson & Johnson 0.95% 01-SEP-2027Yield to maturity
—
Maturity date
Sep 1, 2027
JNJ6009542
Johnson & Johnson 4.55% 01-MAR-2028Yield to maturity
—
Maturity date
Mar 1, 2028
JNJ.GR
Johnson & Johnson 5.85% 15-JUL-2038Yield to maturity
—
Maturity date
Jul 15, 2038
JNJ4077469
Johnson & Johnson 4.5% 05-DEC-2043Yield to maturity
—
Maturity date
Dec 5, 2043
See all 0R34 bonds
Curated watchlists where 0R34 is featured.


Frequently Asked Questions
The current price of 0R34 is 178.0 USD — it has decreased by −0.92% in the past 24 hours. Watch JOHNSON & JOHNSON COM USD1 stock price performance more closely on the chart.
Depending on the exchange, the stock ticker may vary. For instance, on LSE exchange JOHNSON & JOHNSON COM USD1 stocks are traded under the ticker 0R34.
0R34 stock has risen by 1.54% compared to the previous week, the month change is a 5.79% rise, over the last year JOHNSON & JOHNSON COM USD1 has showed a 38.16% increase.
We've gathered analysts' opinions on JOHNSON & JOHNSON COM USD1 future price: according to them, 0R34 price has a max estimate of 200.00 USD and a min estimate of 155.00 USD. Watch 0R34 chart and read a more detailed JOHNSON & JOHNSON COM USD1 stock forecast: see what analysts think of JOHNSON & JOHNSON COM USD1 and suggest that you do with its stocks.
0R34 reached its all-time high on Aug 22, 2025 with the price of 181.0 USD, and its all-time low was 119.6 USD and was reached on Jun 1, 2018. View more price dynamics on 0R34 chart.
See other stocks reaching their highest and lowest prices.
See other stocks reaching their highest and lowest prices.
0R34 stock is 2.02% volatile and has beta coefficient of 0.20. Track JOHNSON & JOHNSON COM USD1 stock price on the chart and check out the list of the most volatile stocks — is JOHNSON & JOHNSON COM USD1 there?
Today JOHNSON & JOHNSON COM USD1 has the market capitalization of 431.79 B, it has increased by 2.01% over the last week.
Yes, you can track JOHNSON & JOHNSON COM USD1 financials in yearly and quarterly reports right on TradingView.
JOHNSON & JOHNSON COM USD1 is going to release the next earnings report on Oct 21, 2025. Keep track of upcoming events with our Earnings Calendar.
0R34 earnings for the last quarter are 2.77 USD per share, whereas the estimation was 2.68 USD resulting in a 3.29% surprise. The estimated earnings for the next quarter are 2.75 USD per share. See more details about JOHNSON & JOHNSON COM USD1 earnings.
JOHNSON & JOHNSON COM USD1 revenue for the last quarter amounts to 23.74 B USD, despite the estimated figure of 22.85 B USD. In the next quarter, revenue is expected to reach 23.73 B USD.
0R34 net income for the last quarter is 5.54 B USD, while the quarter before that showed 11.00 B USD of net income which accounts for −49.66% change. Track more JOHNSON & JOHNSON COM USD1 financial stats to get the full picture.
Yes, 0R34 dividends are paid quarterly. The last dividend per share was 1.30 USD. As of today, Dividend Yield (TTM)% is 2.80%. Tracking JOHNSON & JOHNSON COM USD1 dividends might help you take more informed decisions.
JOHNSON & JOHNSON COM USD1 dividend yield was 3.40% in 2024, and payout ratio reached 84.80%. The year before the numbers were 3.00% and 84.93% correspondingly. See high-dividend stocks and find more opportunities for your portfolio.
As of Aug 25, 2025, the company has 139.8 K employees. See our rating of the largest employees — is JOHNSON & JOHNSON COM USD1 on this list?
EBITDA measures a company's operating performance, its growth signifies an improvement in the efficiency of a company. JOHNSON & JOHNSON COM USD1 EBITDA is 29.23 B USD, and current EBITDA margin is 31.71%. See more stats in JOHNSON & JOHNSON COM USD1 financial statements.
Like other stocks, 0R34 shares are traded on stock exchanges, e.g. Nasdaq, Nyse, Euronext, and the easiest way to buy them is through an online stock broker. To do this, you need to open an account and follow a broker's procedures, then start trading. You can trade JOHNSON & JOHNSON COM USD1 stock right from TradingView charts — choose your broker and connect to your account.
Investing in stocks requires a comprehensive research: you should carefully study all the available data, e.g. company's financials, related news, and its technical analysis. So JOHNSON & JOHNSON COM USD1 technincal analysis shows the buy rating today, and its 1 week rating is buy. Since market conditions are prone to changes, it's worth looking a bit further into the future — according to the 1 month rating JOHNSON & JOHNSON COM USD1 stock shows the strong buy signal. See more of JOHNSON & JOHNSON COM USD1 technicals for a more comprehensive analysis.
If you're still not sure, try looking for inspiration in our curated watchlists.
If you're still not sure, try looking for inspiration in our curated watchlists.