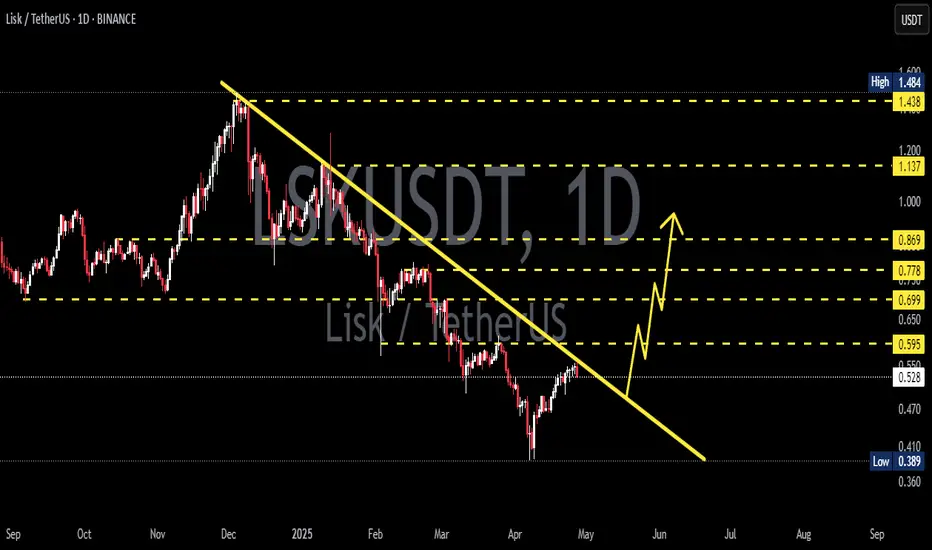
LSKUSDT Forming Falling WedgeLSKUSDT is forming a clear falling wedge pattern, a classic bullish reversal signal that often indicates an upcoming breakout. The price has been consolidating within a narrowing range, suggesting that selling pressure is weakening while buyers are beginning to regain control. With consistent volume confirming accumulation at lower levels, the setup hints at a potential bullish breakout soon. The projected move could lead to an impressive gain of around 190% to 200% once the price breaks above the wedge resistance.
This falling wedge pattern is typically seen at the end of downtrends or corrective phases, and it represents a potential shift in market sentiment from bearish to bullish. Traders closely watching LSKUSDT are noting the strengthening momentum as it nears a breakout zone. The good trading volume adds confidence to this pattern, showing that market participants are positioning early in anticipation of a reversal.
Investors’ growing interest in LSKUSDT reflects rising confidence in the project’s long-term fundamentals and current technical strength. If the breakout confirms with sustained volume, this could mark the start of a fresh bullish leg. Traders might find this a valuable setup for medium-term gains, especially as the wedge pattern completes and buying momentum accelerates.
✅ Show your support by hitting the like button and
✅ Leaving a comment below! (What is your opinion about this Coin?)
Your feedback and engagement keep me inspired to share more insightful market analysis with you!
Market insights
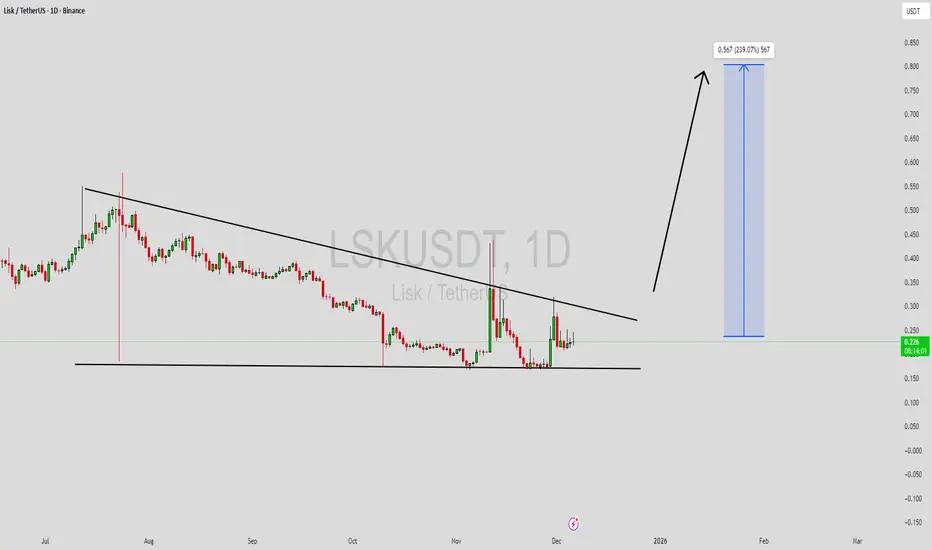
LSKJSE:LSK is trading inside a clean falling wedge pattern and the structure is tightening. Once it breaks out, the move from the current price to the target offers a potential 500 percent gain. Momentum is building and this setup looks ready for a major reversal.

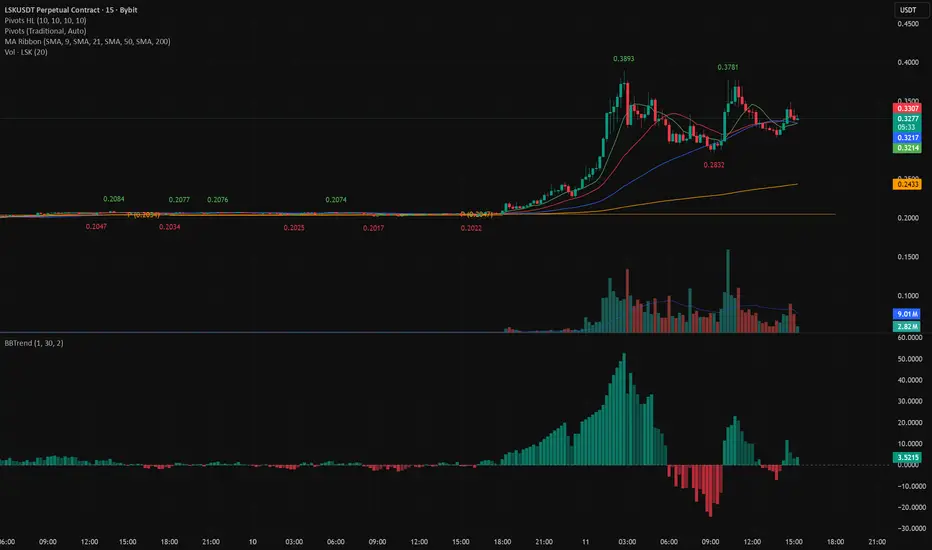
Scalp SHORT – LSK🐻 Scalp SHORT – LSK
LSK has surged aggressively, pushing RSI into extreme overbought territory (reaching up to 90) and forming strong bearish divergences on both the 15m and 1h timeframes. Buying momentum is clearly weakening, while price action shows exhaustion near the local top. This strongly signals a potential sharp correction.
🎯 TP: 0.1756
🛡️ SL: 0.2917
📊 RR: 1 : 5.33
A clean short setup: extreme overbought conditions + multi-timeframe bearish divergence → high probability of downside pressure.

LSKUSDT Forming Bullish MomentumLSKUSDT is forming a clear Bullish Momentum pattern, a classic bullish reversal signal that often indicates an upcoming breakout. The price has been consolidating within a narrowing range, suggesting that selling pressure is weakening while buyers are beginning to regain control. With consistent volume confirming accumulation at lower levels, the setup hints at a potential bullish breakout soon. The projected move could lead to an impressive gain of around 140% to 150% once the price breaks above the wedge resistance.
This falling wedge pattern is typically seen at the end of downtrends or corrective phases, and it represents a potential shift in market sentiment from bearish to bullish. Traders closely watching LSKUSDT are noting the strengthening momentum as it nears a breakout zone. The good trading volume adds confidence to this pattern, showing that market participants are positioning early in anticipation of a reversal.
Investors’ growing interest in LSKUSDT reflects rising confidence in the project’s long-term fundamentals and current technical strength. If the breakout confirms with sustained volume, this could mark the start of a fresh bullish leg. Traders might find this a valuable setup for medium-term gains, especially as the wedge pattern completes and buying momentum accelerates.
✅ Show your support by hitting the like button and
✅ Leaving a comment below! (What is your opinion about this Coin?)
Your feedback and engagement keep me inspired to share more insightful market analysis with you!
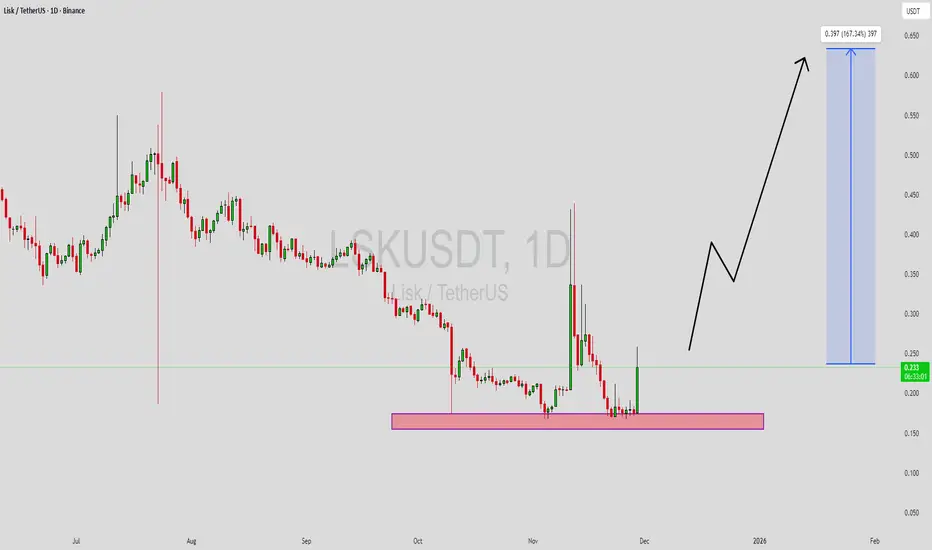
LSKJSE:LSK is setting up for a strong move, with a potential 460 percent gain from the current price. The structure looks clean and momentum is slowly shifting in favor of the bulls. Perfect setup for patient accumulation.

Crypto Intraday ScannerGabriel’s <1D Scalp — Ultra Short-Term Momentum Screener
Description:
Gabriel’s <1D Scalp is a high-frequency, short-duration trading screener designed to detect intra-day scalping opportunities with extreme volume acceleration, abnormal liquidity spikes, and volatile price movement.
It isolates assets showing rapid intraday expansion — ideal for traders executing 5-minute to hourly rotations within a single trading session.
Built for precision scalpers, momentum specialists, and crypto day traders, this screener thrives on volatility bursts where reaction speed and confirmation matter most.
<1D Scanner: www.tradingview.com
1~5D Swing: www.tradingview.com
⚙️ Core Framework
🔍 Volatility & Volume Shock Filters
Vol Change (24h) ≥ 500 % — identifies assets experiencing explosive turnover increases, signaling sudden participation or catalyst events.
Change (24h) outside ± 2 % — eliminates flat consolidations; focuses only on markets in motion.
ADR ≥ 2 % — controls for excessive overnight or foreign volatility noise.
Together, these three filters ensure you’re targeting the fastest-moving, most liquid charts in real time.
📊 Liquidity & Accessibility
Rank ≤ 1000 — keeps focus on top-tier assets by liquidity and market interest.
Market Cap / FD Market Cap filters → avoid thin or manipulated micro-caps.
Volume / Market Cap ratio — ensures sufficient intraday liquidity to enter and exit scalps quickly.
This balance allows scalpers to operate in environments where slippage and spread risk are minimal while volatility remains high.
⚡ Directional Bias
24-Hour Change ± 2 % zone break filters for assets that have already escaped their prior range — the “momentum in motion” principle.
Intraday bias is determined by the first major 1-minute to 15-minute breakout candle relative to VWAP or prior-session equilibrium.
🧩 How It Works
Pre-scan: Identify assets meeting the ≥ 500 % volume surge condition.
Confirm: Check volatility expansion via ATR or live candle spread.
Execute: Enter trades using micro-timeframes (< 1 h) with tight stop placement based on sub-ATR movement.
Exit: Scale out once volume or volatility tapers — no overnight holding.
This structure mirrors prop-style scalping frameworks where trade expectancy relies on range exploitation, not extended trend continuation.
💹 Use Case
Best suited for:
Crypto scalpers trading perpetuals or high-turnover spot pairs.
Equity momentum traders focusing on 5-minute and 15-minute ORBs.
Algorithmic or discretionary intraday systems that exploit short-term inefficiencies.
The screener’s dynamic filters allow you to adapt to market rotations — catching both explosive up-moves and rapid reversals.
LSKUSDT Forming Falling WedgeLSK/USDT has caught my attention as it shows a classic falling wedge pattern forming on the chart, which typically signals a bullish reversal if confirmed. The chart structure suggests that the down-trending highs are compressing toward the lows, meaning the range is tightening and pressure is building for a breakout. Volume has been picking up lately, indicating that investor interest is increasing and participants are preparing for a move. Given this context, a break above the upper trendline of the wedge could trigger a strong bullish run.
On the fundamentals, Lisk (LSK) is positioning itself as a developer-friendly blockchain that supports dApps written in JavaScript and sidechain architecture—a niche that remains underappreciated in the broader crypto market. Its circulating supply is around 210 million tokens and recent 24-hour trading volumes have surged past US$300 million. The token recently soared ~70% in a day, driven by a short squeeze and renewed derivative interest, signalling that the market has begun to reassess its potential after a long slide. With legacy chains increasingly looking for revival and altcoins rotating back into focus, LSK could be one of the beneficiaries.
In terms of strategy, the falling wedge sets up two ways in: a breakout above the wedge’s upper boundary with sustained volume, or a more conservative entry after the breakout pulls back to test the trendline now turned support. If the breakout is confirmed, a target of +130% to +140%+ gains aligns with the pattern’s measured move and the low-cap environment that typically allows altcoins to rally aggressively. Risk should be managed by placing a stop below the most recent swing low or below the lower wedge trendline to keep a defined risk-to-reward ratio.
In summary, LSK/USDT is showing the technical and fundamental alignment for a major opportunity if a breakout occurs. The falling wedge, rising volume and renewed investor interest all point to a setup worth monitoring closely. Show your support by hitting the like button and
Leaving a comment below! (What is You opinion about this Coin)
Your feedback and engagement keep me inspired to share more insightful market analysis with you!

LSKUSDT.P - 1 H Chart Live Analysis With CGI IndicatorLSKUSDT.P - 1 H Chart Live Analysis With CGI Indicator
Waiting For Long Tag To Form On Our CGI Indicator

LSKUSDT 1D AnalysisLSK ~ 1D Analysis
#LSK Buy after successfully penetrating this resistant line with a short -term target of at least 10%+ from here.
LSKUSDT 1WLSK ~ 1W Analysis
#LSK Buy gradually from here with a short -term target of at least 20%+. This is the lowest support for now.
LSKUSDT 1WLSK ~ 1W Analysis
#LSK Buy gradually from here if you still have a Conviction on this Coin with a minimum target of 20%++
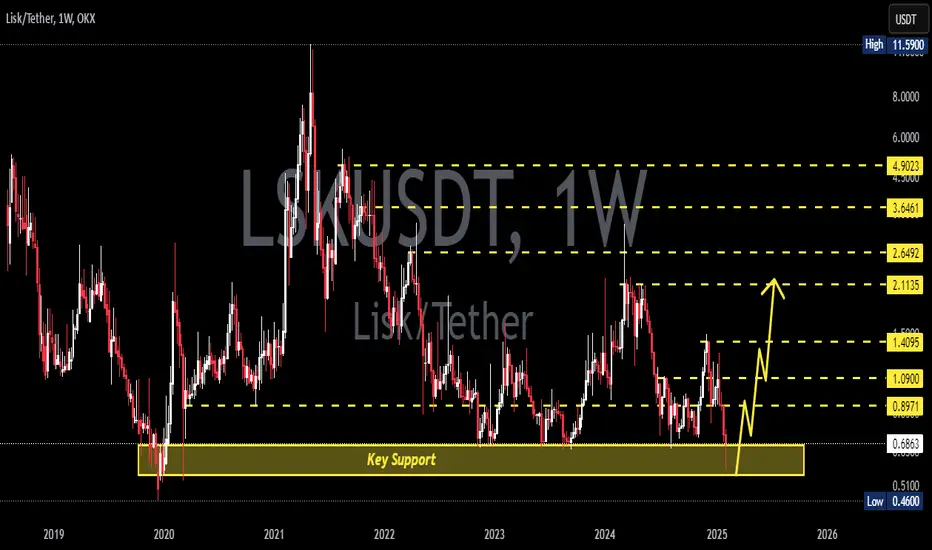
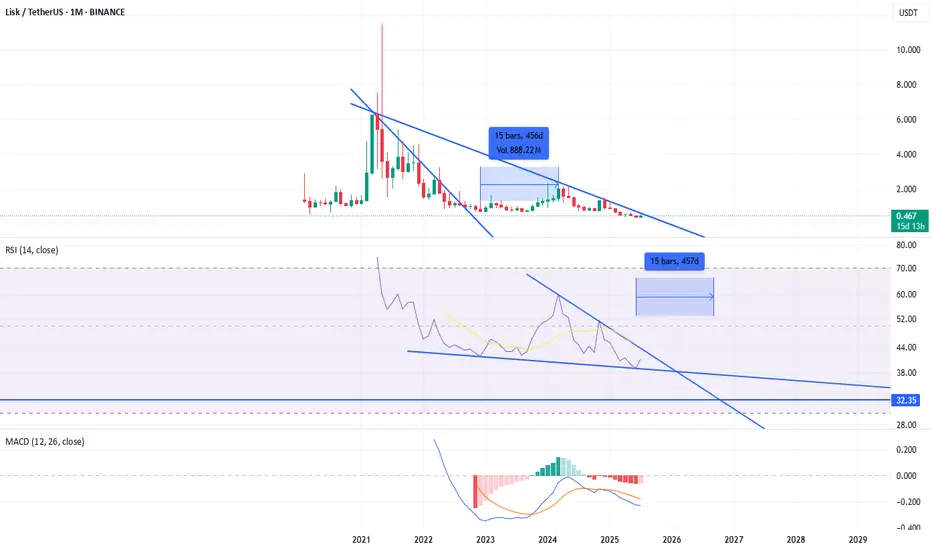
Long-Term Consolidation & Bullish-Run —1695% Potential (LSKUSDT)Bottom prices. Can you see it?
Easy to see. Bottom prices.
No opportunities have been missed.
When one door closes, a new door opens.
Everything has its advantage and disadvantage.
We live in a world of duality.
Night and day. This defines everything.
Up and down.
Joy and pain.
Profits and profits.
Win, win, win.
Namaste.
...
Here we have LSKUSDT (Lisk) trading at long-term bottom prices and within a long-term consolidation zone. Some pairs are already trading high up, but many others are still trading low.
If we want to do awesome in this year 2025, trading spot, we have to focus on the pairs with the highest growth potential and the lowest risk. Trading at bottom prices is low risk because there is nothing lower than the bottom. After buying we simply wait.
We can entertain ourselves by developing a plan or studying the market, or by doing something completely different all-together, that is up to you. But we have to enter at the right time not when there is noise, hype and too much excitement, these are the signals that reveal that it might already be too late.
Notice how quiet everything is now. Remember August 2024?
This is it, a repeat. Now the market sentiment is kind of depressed; now the Altcoins are trading low. This is the best time to accumulate; buy and hold.
This can change everything. Once the action starts and the market starts moving it is just wonderful to have a great entry. When the retraces and corrections develop, we can rest easy with our position because we have the best entry-timing in the world.
This is another good chart setup. I am not talking about fundamentals here, this is purely technical analysis. But this a project that has been around for a while and has been proven solid, like many of the ones that I share.
I focus mainly on TA with huge potential for growth, but these are solid projects that have been around for many years, and these have the potential to do great.
Not in four years, nor three years nor far away in the future. The time is now. It will happen now, in 2025, in a matter of weeks, maximum a few months. Everything will be green and trading high... Are you ready?
Thanks a lot for your continued support.
Additional details can be found on the chart.
Namaste.

LSKUSDT 1WLSK ~ 1W
#LSK So far it continues to maintain this support block,. If you want to buy this coin back,. This support block is a good buying place for now.

LSKUSDT.1DAs I analyze the LSK/USDT daily chart, the price is currently trading at 1.090, showing a gradual recovery after a prolonged consolidation period. The chart displays a breakout from a range-bound structure, signaling growing bullish momentum. Key levels are highlighted to better understand the price dynamics.
The immediate resistance is at R1 (1.189), which aligns with the upper boundary of the previous consolidation range. If LSK successfully breaks above this level, the next significant resistance lies at R2 (1.573). A breakout beyond R2 could confirm a stronger bullish trend, potentially leading to a broader rally.
On the downside, the immediate support is at S1 (0.647), which has acted as a strong base during previous price corrections. A breakdown below this level could signal bearish pressure, with further downside potential.
The MACD (12, 26) indicator currently shows bullish momentum, with the MACD line above the signal line and positive histogram bars. This suggests that buyers remain in control. Meanwhile, the RSI (14) is at 65.02, nearing overbought territory. While this confirms the strength of the recent rally, it also signals caution, as a short-term correction or consolidation may be on the horizon.
If LSK can sustain its momentum and break through R1, the price is likely to target R2 as the next significant level. Conversely, failure to hold above R1 could result in a pullback toward the S1 support zone, offering potential accumulation opportunities for long-term bullish setups.
In conclusion, my outlook for LSK/USDT is cautiously optimistic. The key focus remains on whether the price can sustain above R1 and target R2. I will monitor the RSI and price action closely for signs of a breakout or potential retracement, ensuring an adaptable approach based on market conditions.

LSK Technical Analysis in Weekly TimeframeHello everyone, I’m Cryptorphic.
For the past seven years, I’ve been sharing insightful charts and analysis.
Follow me for:
~ Unbiased analyses on trending altcoins.
~ Identifying altcoins with 10x-50x potential.
~ Futures trade setups.
~ Daily updates on Bitcoin and Ethereum.
~ High time frame (HTF) market bottom and top calls.
~ Short-term market movements.
~ Charts supported by critical fundamentals.
Now, let’s dive into this chart analysis:
#LSK has been under a downtrend since March 2024, when it made a local high of $3.250. So far, it has already dropped 77%, and according to this weekly timeframe, it is yet to reach the absolute bottom.
The primary support is at $0.637, from where we can expect a rebound toward the upper resistance trendline at $1.42. The lower support level is at $0.510, which is also an all-time low for #LSK.
- Important Support/Entry: $0.510 to $0.637.
- Resistance: $1.42.
- All-time high: Need to do 17x from the support level.
- Invalidation Point: A breakdown and close below the lower support level.
DYOR, NFA.
Please hit the like button to support my content and share your thoughts in the comment section. Feel free to request any chart analysis you’d like to see!
Thank you!
#PEACE

LSK looks bearishIt looks like a bullish ABC is over and now price has entered a new pattern or wave D.
The supply range and the demand range have been determined.
The target of this drop box is green.
Closing a daily candle below the invalidation level will violate the bullish movement
For risk management, please don't forget stop loss and capital management
When we reach the first target, save some profit and then change the stop to entry
Comment if you have any questions
Thank You

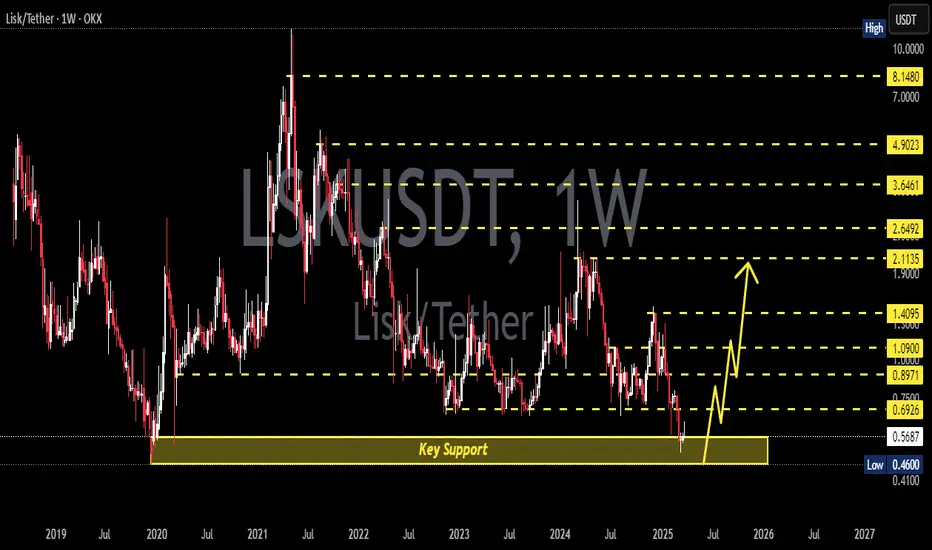
Good opportunity to buy LSK.Lisk (LSK) is in good entry zone now. This is trade (investment) setup on larger timeframe. I am not looking to reach targets 2,3,4,5 and 6 very soon, that could be year(s). I will sell most of my capital on targets 3,4 and 5. Small portion will be sold on targets 1,2 and 6.
Entry Zone: 0.60 – 1.07
Target 1: 2.57 – 2.84 (144%)
Target 2: 4.69 – 4.93 (342%)
Target 3: 8.03– 8.47 (646%)
Target 4: 10.96 – 11.25 (925%)
Target 5: 15.16 – 15.81 (1308%)
Target 6: 18.19 – 19.51 (1663%)

LSK/USDT falling wedge breakout ? what next💎 Paradisers, take note as #LSKUSDT has successfully broken out from a falling wedge, signaling a strong possibility of a bullish trend. Currently, the 100-day moving average is acting as resistance.
💎 Upon close examination, we've noticed that the Bollinger Bands are tightening, which typically increases the likelihood of an upward move. As for now, JSE:LSK , after breaking out from the falling wedge and completing its retest phase, is regaining momentum at the demand level of $1.467. If it can sustain this momentum, there is a high probability it will embark on a bullish path to overcome our specified resistance level.
💎 However, given the inherent volatility of the market, if #LSK fails to sustain its momentum and declines, this could indicate a weakening of the bullish stance, potentially leading to a significant price drop. Under such circumstances, we might expect a bullish rebound from the lower, strong Bullish OB level at $1.409. Nevertheless, a break below this level could result in considerable downward movement.
MyCryptoParadise
iFeel the success🌴

LSK long setup ALL trading ideas have entry point + stop loss + take profit + Risk level.
hello Traders, here is the full analysis for this pair, let me know in the comment section below if you have any questions, the entry will be taken only if all rules of the strategies will be satisfied. I suggest you keep this pair on your watchlist and see if the rules of your strategy are satisfied. Please also refer to the Important Risk Notice linked below.
Disclaimer

LSK ANALYSIS🔮 #LSK Analysis 💰💰
📊 #LSK is making perfect and huge rounding bottom pattern in weekly time frame, indicating a potential bullish move. If #LSK breakout the pattern with high volume then we will get a bullish move📈
🔖 Current Price: $1.863
⏳ Target Price: $3.612
⁉️ What to do?
- We have marked crucial levels in the chart . We can trade according to the chart and make some profits. 🚀💸
#LSK #Cryptocurrency #Pump #DYOR

LSKUSDT ShortAfter Fake out and Touching the FVG Lisk is moving down. Follow the setup, Look out for FVG below, You Can close partly there before hitting the target. Happy Trading Friends

LSK LSK has broken the corrective price channel, confirming the start of next impulsive wave.
Minor correction to 1.66 is expected which is a great Entry.
