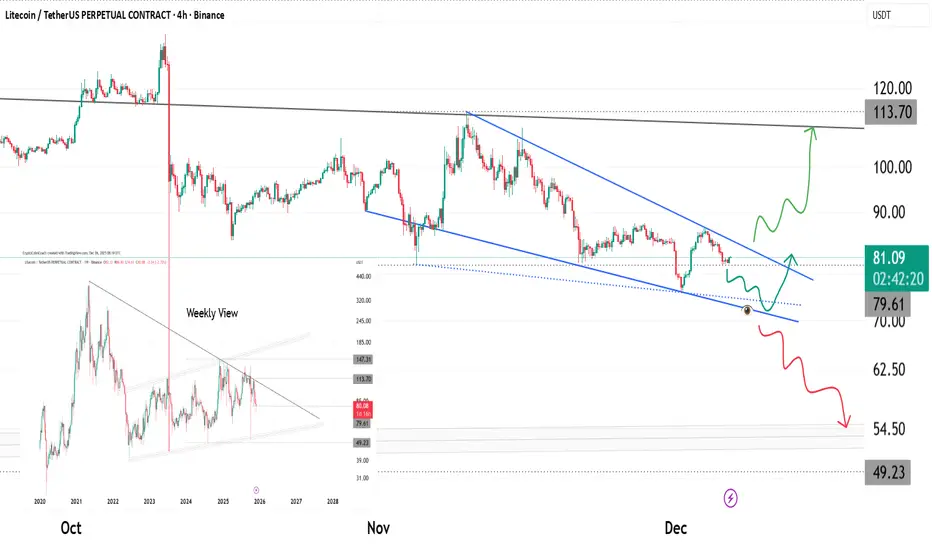
LTC can break the descending channel 33% gain toward 110$ Hi,
The support and resistances on the chart are based on the previous data and weekly candlesticks,
BINANCE:LTCUSDT nis in the descending channel now and close to the resistance side if it holds this position and these last support the potential of 33% gain is logical toward 110$.
and breakout o


Litecoin (LTC): Looking For Bullish Breakout From 100EMALTC looks pretty bullish, especially after the recent push we had when we formed that "Bart Simpson" type movement. Now we look for the 100 EMA to be fully secured by buyers!
More in-depth info is in the video—enjoy!
Swallow Academy

LTCUSDT (4H) chart update !!Litecoin is holding a strong demand zone around 76–80 and moving sideways under a long-term descending trendline.
A confirmed breakout above the trendline (~84) could trigger a bullish move toward 92, then 100, and ultimately 120.
If the price falls below the 76 support, the downside risk remains t

This is why I don't trade on weekends...CRYPTOCAP:LTC shorts got rekt on the way up
Longs got rekt on the way down
Who won? The ones who had the liquidity to actually move the market to their willing
Trading on weekends is basically donating the money to the ones who move the market during low volume low liquidity weekend periods
Avo

LTC Approaching Key 4H FVG Zone_Reversal Setup AheadLTC is showing clear weakness and continues to drift lower, likely heading toward the 4H FVG zone at $76.2–$77.3. This area will be key for a potential reversal. If price reacts strongly from this zone, a clean recovery move toward the EQH liquidity level at $87.5 is expected. Manage risk wisely and

LTC: Final Compression Before the Break - Major Wedge EndingLitecoin is trading inside a clean falling wedge after multiple rejections from the macro trendline visible on the weekly chart. Price is now squeezing toward the apex with momentum flattening out.
Key notes:
• Bullish scenario: A breakout above the wedge resistance + reclaim of 85–87 opens ro
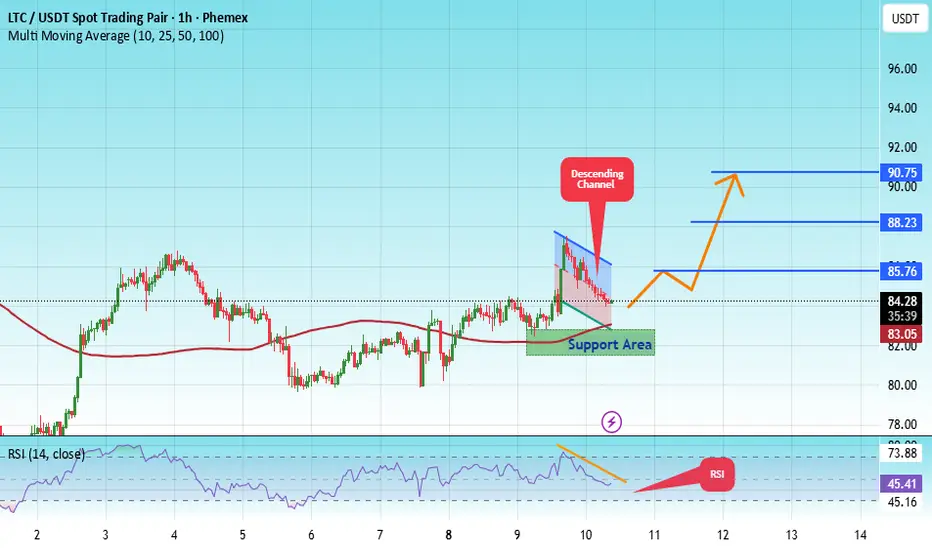
#LTC/USDT analysis.Give me some energy !!!#LTC
The price is moving in a descending channel on the 1-hour timeframe. It has reached the lower boundary and is heading towards breaking above it, with a retest of the upper boundary expected.
We have a downtrend on the RSI indicator, which has reached near the lower boundary, and an upward reb
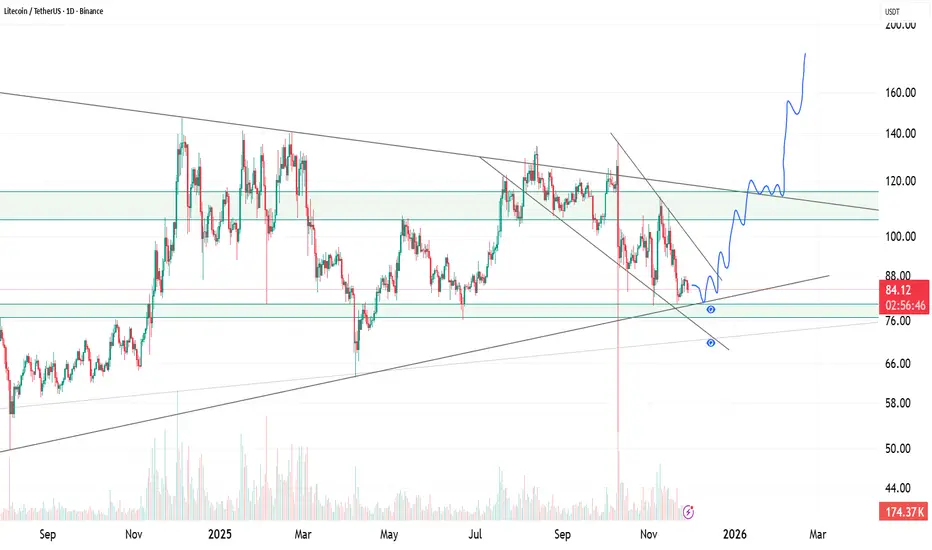
LTC , Retesting Major Support With a Potential Breakout SetupLTC is trading inside a long-term symmetrical wedge while also forming a smaller falling channel in the recent down-move. Price has reached a critical area where multiple technical factors overlap:
• A long-term ascending support trendline
• Horizontal support between $76–$82
• The lower boundary
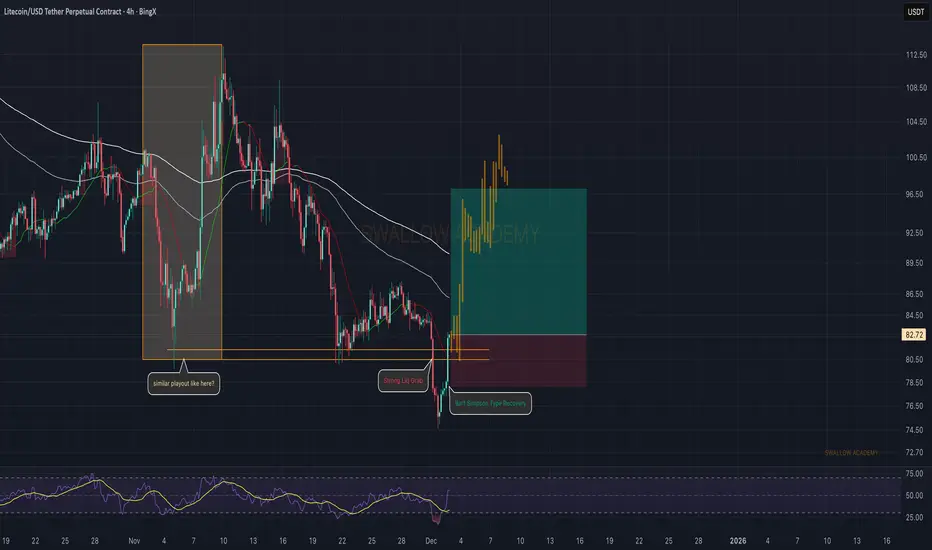
Litecoin (LTC): Seeing Similar Pattern | Bart Simpson PushLTC pulled a strong liquidity grab and instantly recovered with a classic Bart-Simpson type move — very similar to the playout we had earlier in November. If buyers manage to hold this recovery structure and keep pushing above the EMAs, we could see another upside leg forming the same way.
As long
See all ideas
Summarizing what the indicators are suggesting.
Oscillators
Neutral
SellBuy
Strong sellStrong buy
Strong sellSellNeutralBuyStrong buy
Oscillators
Neutral
SellBuy
Strong sellStrong buy
Strong sellSellNeutralBuyStrong buy
Summary
Neutral
SellBuy
Strong sellStrong buy
Strong sellSellNeutralBuyStrong buy
Summary
Neutral
SellBuy
Strong sellStrong buy
Strong sellSellNeutralBuyStrong buy
Summary
Neutral
SellBuy
Strong sellStrong buy
Strong sellSellNeutralBuyStrong buy
Moving Averages
Neutral
SellBuy
Strong sellStrong buy
Strong sellSellNeutralBuyStrong buy
Moving Averages
Neutral
SellBuy
Strong sellStrong buy
Strong sellSellNeutralBuyStrong buy
Displays a symbol's price movements over previous years to identify recurring trends.