LTC can break the descending channel 33% gain toward 110$ Hi,
The support and resistances on the chart are based on the previous data and weekly candlesticks,
BINANCE:LTCUSDT nis in the descending channel now and close to the resistance side if it holds this position and these last support the potential of 33% gain is logical toward 110$.
and breakout of this descending channel will be completed.
Trade ideas

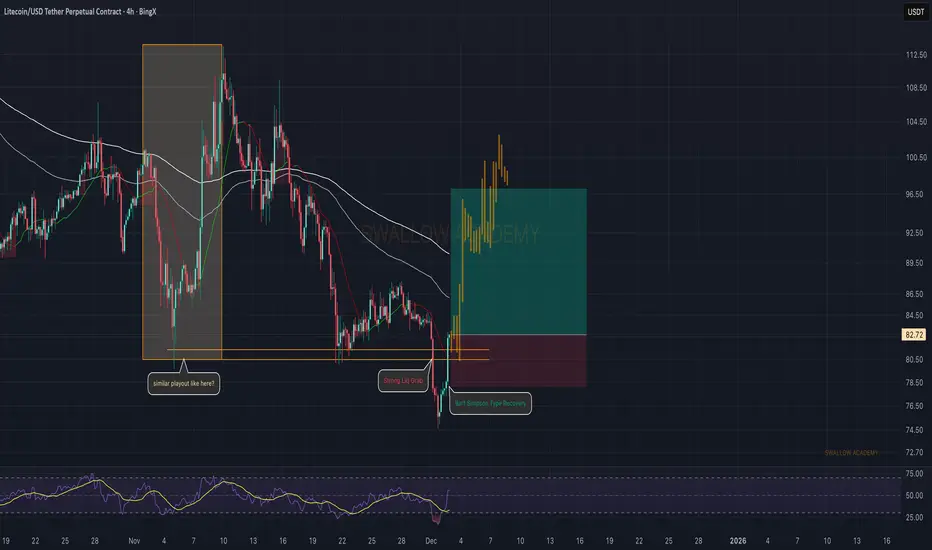
Litecoin (LTC): Seeing Similar Pattern | Bart Simpson PushLTC pulled a strong liquidity grab and instantly recovered with a classic Bart-Simpson type move — very similar to the playout we had earlier in November. If buyers manage to hold this recovery structure and keep pushing above the EMAs, we could see another upside leg forming the same way.
As long as price stays above the grab zone, momentum stays on buyers’ side and this setup remains valid for continuation.
Swallow Academy
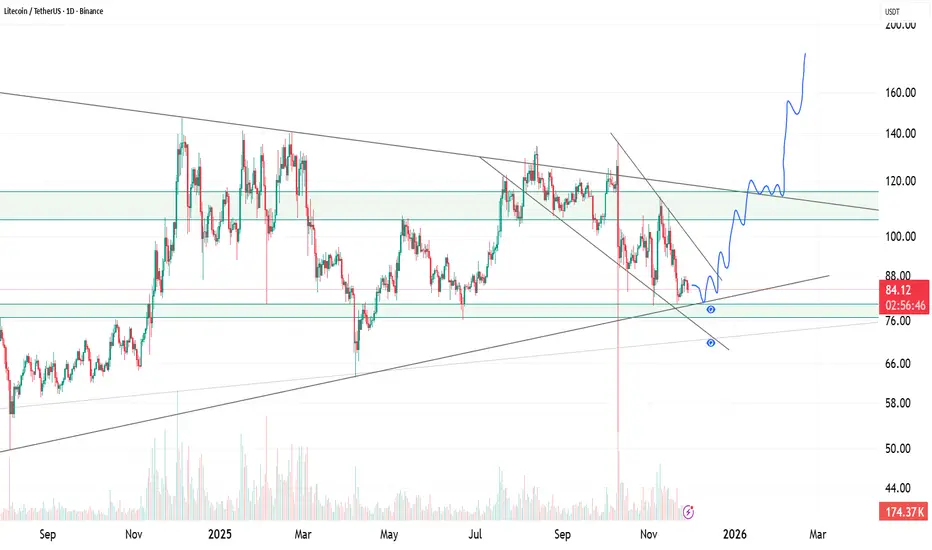
LTC , Retesting Major Support With a Potential Breakout SetupLTC is trading inside a long-term symmetrical wedge while also forming a smaller falling channel in the recent down-move. Price has reached a critical area where multiple technical factors overlap:
• A long-term ascending support trendline
• Horizontal support between $76–$82
• The lower boundary of the falling mini-channel
• Increasing wick rejections showing buyer interest
This zone has acted as a strong accumulation region multiple times in the past.
If LTC holds this support and breaks above the falling channel, it could trigger a shift in momentum and open the path toward the mid-range and upper resistance levels.
Key levels to watch:
• Support: $76 – $82
• First reclaim trigger: Break above $88
• Major breakout zone: $102 – $120
Invalidation:
A clean breakdown below $76 would invalidate the bullish setup and expose deeper levels.
Summary:
LTC is at a high-interest zone. Holding this support + breaking the falling channel can start the next upward leg. Losing the zone flips the structure bearish.
FireHoseReel | LTC:When does Litecoin explode next?🔥 Welcome to FireHoseReel!
Let’s dive into the 4H Litecoin (LTC) analysis.
👀 Litecoin is currently trading below a descending curve trendline.
Each time price hits this curve, it gets rejected to the downside. Price is now approaching the end of this compression zone, while a key support has formed at $81.48 near the bottom.
📊 Litecoin volume has been declining during the recent drop and is now at very low levels.
Once volume expands again, any upcoming move in LTC is likely to become more impulsive and powerful.
✅ The LTC/BTC pair is also in a strong corrective phase, showing a noticeable decline in Litecoin’s relative strength against Bitcoin.
✍️ You can review the main Litecoin scenarios below and use them alongside your own trading strategy if needed.
🟢 Long Scenario:
A breakout above the descending curve trendline, followed by a clean pullback, and then a push toward the static resistance at $87.42 with rising buy volume, could activate our long trigger.
🔴 Short Scenario:
A breakdown below the $81.48 support with a confirmed close below this level and increasing sell volume could activate our short trigger.
❤️ Risk Management & Emotional Discipline
Crypto trading is highly risky. Without proper risk management and emotional control, trading is no different from gambling.
Logic must always come before emotions. Learn to manage your trades—and enjoy the process of trading with control and discipline.

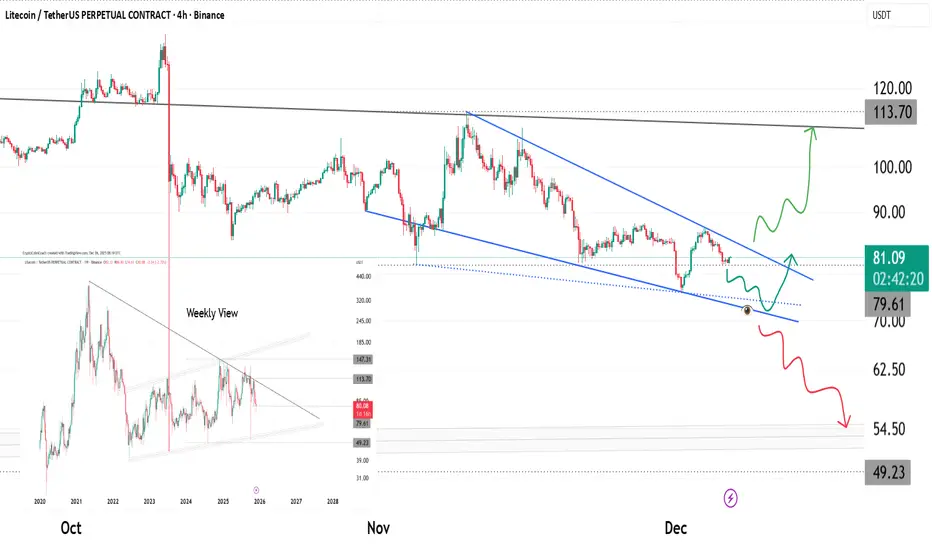
LTC: Final Compression Before the Break - Major Wedge EndingLitecoin is trading inside a clean falling wedge after multiple rejections from the macro trendline visible on the weekly chart. Price is now squeezing toward the apex with momentum flattening out.
Key notes:
• Bullish scenario: A breakout above the wedge resistance + reclaim of 85–87 opens room toward 113.70 and later the macro resistance at 120 .
• Bearish scenario: Losing the lower wedge line + breakdown from 79–80 can send LTC toward 54–49 demand.
Reasons this level matters:
• The wedge has 60+ days of compression
• Weekly multi-year trendline shows confluence
• Local liquidity pools positioned right above current price
• Multiple reaction wicks signaling absorption
Watching the reaction at 79–82 will reveal the next wave: strong bounce = bullish continuation, weak retest = deeper correction.
Litecoin Below 70$ Soon.#Litecoin Below 70$ Soon...
After that it'll go for exit liquidity .
Be Safe Guys.

LTCUSDT swing tradeA simple setup for trading, here we should focus on range trading of support and resistance zones, the price reached the supp level where opening a long position may look very attractive, setting a stop loss beyond of support line, nothing complicated, just following basic fundamentals of trading, trying to catch profits while the price is moving from and to both zones

LITECOIN IS FULLY CHARGEDHey traders! LTC has been quietly accumulating energy in this tight range for days — all the coils are compressed, and the spring is about to pop!
I’m expecting a strong impulsive move upward very soon.
My targets:
🎯 Target 1 — 89
🎯 Target 2 — 91.20 (main zone I’m watching)
❌Invalidation (plan cancelled): 85.89
If we break and hold above the recent highs, this thing can run fast. Watching it closely!
Who’s in? Smash the like & follow for updates 🔥

LTCUSDT LongConsolidation on H4 Chart, now price is on the bottom of pattern. Bullish signal is clear, Risk Reward 1:5

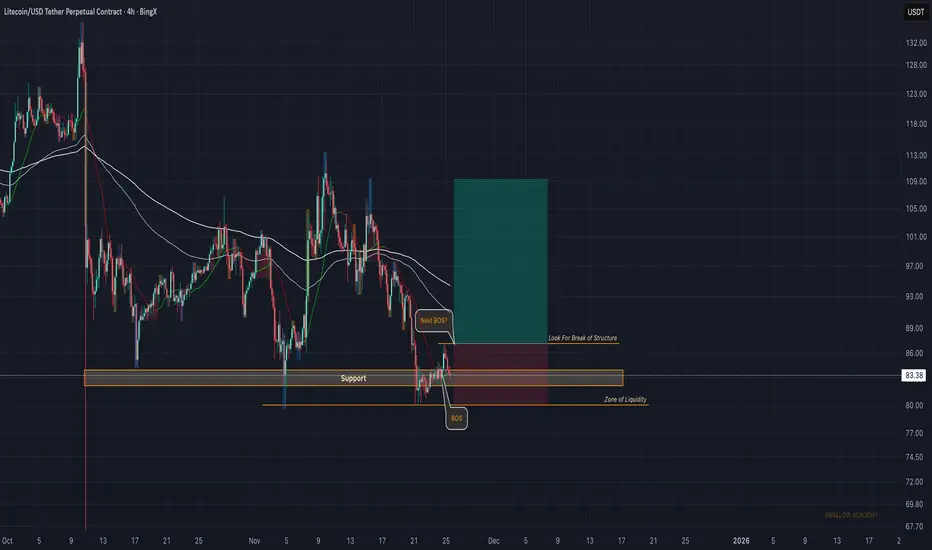
Litecoin (LTC): First BOS Formed, Now Looking For Second BOSLTC finally gave us the first BOS, which already flipped the short-term trend and showed that buyers are stepping in. Now we want to see a second BOS as confirmation — that’s the key signal that momentum is shifting properly in our favor.
If we get that second BOS, a long setup opens up with a good R:R toward the higher targets. Until then, patience — we let the chart show us that buyers actually want to take control.
Swallow Academy
LTC USDT LONG SIGNAL---
📢 Official Trade Signal – LTC/USDT
📈 Position Type: LONG
💰 Entry Price: 82.54
---
🎯 Take-Profit Targets (Partial Exits):
TP1 = 84.48
TP2 = 86.61
TP3 = 88.89
TP4 = 91.96
TP5 = 94.53
---
🛑 Stop-Loss: 79.17
📊 Timeframe: 15m
⚖️ Risk/Reward Ratio: 4.47
💥 Suggested Leverage: 5× – 10×
---
🧠 Technical Analysis Summary
LTC is showing a strong bullish reaction from the 82.00–82.50 demand zone, forming a clean higher-low structure.
Momentum is shifting upward on the 15m chart, with buyers stepping in at dynamic support.
Liqudity targets align with resistance levels at 84.48, 86.61, 88.89, and higher.
A clean breakout above 84.48 (TP1) can accelerate the move toward mid-range liquidity at 86.61 and 88.89.
---
⚙️ Trade Management Rules
✔️ Take partial profit at TP1
✔️ Move SL to Break-Even immediately after TP1 is hit
✔️ Trail SL as price approaches higher targets
✔️ No re-entry if SL (79.17) gets hit
✔️ Confirm market structure before entering
---
⚠️ Risk-Management Note
When TP1 is reached, SL is moved to Break-Even — this is standard professional risk management.
If price taps TP1 then reverses and hits BE, it is not a loss — it’s a zero-risk exit, protecting capital.
🔐 Capital preservation always comes first.
---
📌 TradingView Hashtags
#LTCUSDT #LTC #CryptoSignal #LongSetup #TradingView
#TechnicalAnalysis #FuturesTrading #Altcoins
---

This is why I don't trade on weekends...CRYPTOCAP:LTC shorts got rekt on the way up
Longs got rekt on the way down
Who won? The ones who had the liquidity to actually move the market to their willing
Trading on weekends is basically donating the money to the ones who move the market during low volume low liquidity weekend periods
Avoid it

Monthly Crypto Analysis: Litecoin (LTCUSD) – Issue 106 (Free AccThe analyst expects Litecoin’s price to decline by the specified end time, based on quantitative analysis.
The take-profit level only highlights the potential price range during this period — it’s optional and not a prediction that the market will necessarily reach it.
You don’t need to go all-in or use leverage to trade wisely.
Allocating just a portion of your funds helps keep overall risk low and ensures a more sustainable approach.
Our strategy is built on institutional portfolio management principles, not the high-risk, all-in trading styles often promoted on social media.
Results are evaluated over the entire analysis period, regardless of whether the take-profit level is reached.
-The validity of this analysis is based on a specific time range (until 21 Dec 2025), and after this period, the analysis will be reviewed and updated (once every 28 days).

litecoin spot plansLTC has been consolidating inside a massive 7-year symmetrical triangle, forming a clean A–B–C–D–E corrective structure. With wave E nearly complete, the pattern is 99% mature — a decisive breakout could be imminent.
This range has trapped traders for years, but structures like this don’t appear every day. Once this triangle resolves, volatility will return and LTC could finally make a macro move after years of compression.
Invalidation below $40.6.

#LTCUSDT - Pivot is $115.73 & Range is between $52 and $178Date: 06-09-2025
#LTCUSDT - Current Price: $110.34
Pivot Point: $115.73 Support: $106.16 Resistance: $125.39
#LTCUSDT Upside Targets:
--------------------------------
| Target | Price |
---------------------------------
| 🎯 Target 1 | $138.63 |
| 🎯 Target 2 | $151.87 |
| 🎯 Target 3 | $165.42 |
| 🎯 Target 4 | $178.98 |
#LTCUSDT Downside Targets:
| 🎯 Target 1 | $92.88 |
| 🎯 Target 2 | $79.59 |
| 🎯 Target 3 | $66.04 |
| 🎯 Target 4 | $52.49 |
#TradingView #Nifty #BankNifty #DJI #NDQ #SENSEX #DAX #USOIL #GOLD #SILVER
#Crypto #Bitcoin #BTC #CryptoTA #TradingView #PivotPoints #SupportResistance

TradeCityPro | LTCUSDT Sellers’ Last Chance!👋 Welcome to TradeCityPro!
Let’s move on to the analysis of LTC, one of the oldest cryptocurrencies in the market, which is currently ranging inside a daily consolidation box.
🌐 Bitcoin Overview
Before we begin, let me remind you once again that at your request, we’ve moved the Bitcoin analysis section to a dedicated daily report — allowing us to analyze Bitcoin’s trend, dominance, and overall market sentiment in greater depth each day.
In the daily timeframe, LTC has been moving within a range for quite some time. However, this time price failed to reach the key resistance at $131 and got rejected earlier than expected — a sign of weakening buyer momentum.
After this early rejection, price pulled back toward $102.36, and that retest pushed the market further down toward the major support at $82.64, where price is currently reacting.
This zone represents the final chance for buyers to hold the structure. If price loses this support, we are likely to see a continuation of the downtrend, targeting the next major level at $68.95.
For buyers, entering a new position only makes sense if price successfully finds support at this level and forms a new bullish structure. Otherwise, as long as LTC is trading below $102.36, we should avoid taking long positions and wait for clearer confirmation.
📝 Final Thoughts
Stay calm, trade wisely, and let's capture the market's best opportunities!
This analysis reflects our opinions and is not financial advice.
Share your thoughts in the comments, and don’t forget to share this analysis with your friends! ❤️

LITECOIN Analysis (4H)It appears that a double correction is forming on Litecoin and is nearing completion. Around the origin zone, we can look for long buy positions so that once this second corrective leg finishes, the price can enter a bullish phase.
The entry zone and targets are marked on the chart.
For risk management, please don't forget stop loss and capital management
When we reach the first target, save some profit and then change the stop to entry
Comment if you have any questions
Thank You

LTCUSDT : Full analysisHello friends
well you see that the power is in the hands of the sellers and we must have sufficient approvals to buy.
So you see, we have two important support areas that we have identified for you with Fibonacci, and they can be good supports. We need to see how buyers react in these areas.
Well, the next point is that despite the sharp drop in Bitcoin, Litecoin did not fall much. It fell by almost half of Bitcoin. Considering the previous times I saw that when Bitcoin fell, other currencies fell several times as much, and this is a good sign (meaning that its holders have a positive view of the currency).
But to buy, we need to know where and when to buy, to find the best point to buy and to take our profits at the best point. For this reason, we expect that Litecoin will most likely bottom out again and buy in support areas with risk and capital management and in steps And to move with the specified goals.
*Trade safely with us*

LTC USDT LONG SIGNALSir📢 Signal
🔹 Currency pair: LTC.USDT
📉 Trade type: long
💰 Entry point:. Market
🎯 Targets (with withdrawal management):
▫️ TP1=93.74
▫️ TP2=95.40
▫️ TP3 =97.30
TP4=
TP5=
TP6=
🛑 Stop loss= 91.30
📊 Time frame:
⚖️ R/R:3.62
📌 Recommended leverage:.5 or 10
⚠️ Money management is required
Please log in after checking the chart

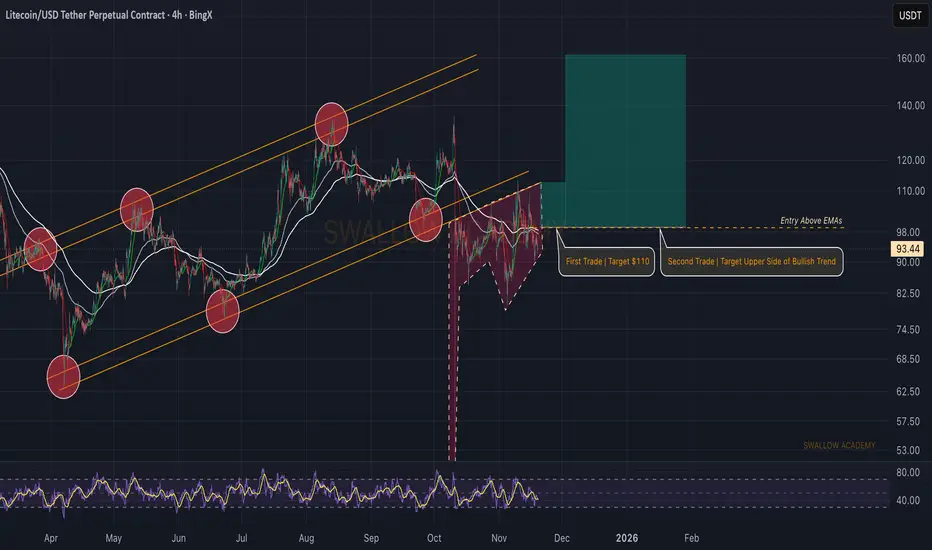
Litecoin (LTC): Looking For Buy Entry | Bullish But Be CarefulLTC is giving us two trade setups here, but both depend on the same thing first—we need a clean breakout above the EMAs. Until buyers secure that area, there’s no reason to rush into any position.
Once we see that breakout and retest holding, the first setup targets around $110, while the second one focuses on the upper side of the bigger bullish channel. For now we just let price do its thing and wait for EMAs to be taken back by buyers before thinking about longs.
Swallow Academy
LTC: Don’t FOMO, Wait for Confirmation$LTC/USDT is getting squeezed between the rising trendline and the overhead resistance zone. Price has tested this resistance multiple times before but failed to break through.
A potential upside move could develop if we finally see a clean close above the marked zone.
Until then, it’s best to stay patient, don’t FOMO, wait for a clear breakout pattern.
DYOR, NFA

LTC Following Perfect Trend, May Breakout SOON !!! Keep an eye on these 2 trendlines for perfect setup
I have bought LTC as per below :
Bought Price : 120
TP : 130 +
Tight SL : 118 (To avoid risk)
Litecoin — “Stay Above Here” or It’s Just Another WickCRYPTOCAP:LTC has the potential to go much higher, but so far it’s mostly reacting, not expanding. The bounce is clean, the structure improved, yet we still haven’t seen the kind of follow-through that turns a squeeze into a real trend.
On my chart I’ve highlighted the decision zone — roughly $134–$140 where the HTF descending trendline and prior supply stack up. That’s the gate. I don’t want a tag-and-fade; I want to see acceptance and time spent above it. When price breaks a key area and holds, it signals intent, not just a stop run.
In the next sessions it’s all about confirmation: push into that band, volume step-up, shallow pullbacks that base above the box, and then continuation. If we get that, the path opens for a proper stair-step: $132 → $140 hold → $150s, and, later, $165–$170 as the next extension. That’s the blueprint drawn on the chart.
Zooming out, LTC/BTC on the weekly is compressing—tight ranges, repeated rejections fading in size, and no loss of the key floor. It’s the same slow build we saw before XRP’s break: absorption candles, “quiet” volatility, liquidity loading. These periods don’t last forever; when they resolve, the move is usually meaningful.
Short term I’ll still treat dips as tests of intent. If price rolls back into the old range and can’t stabilize above the breakout band, it tells us the market wasn’t ready and we’ll need more time. But if LTC can push through and stay above the highlighted zone, the character of the trend changes from reactive to expansionary — and the upside scenario comes alive.
TL;DR: The idea is simple — stay above $134–$140 and the door to $150 → $165–$170 swings open. Fail to hold it, and it’s just another wick.
