LTC can break the descending channel 33% gain toward 110$ Hi,
The support and resistances on the chart are based on the previous data and weekly candlesticks,
BINANCE:LTCUSDT nis in the descending channel now and close to the resistance side if it holds this position and these last support the potential of 33% gain is logical toward 110$.
and breakout o
Related pairs

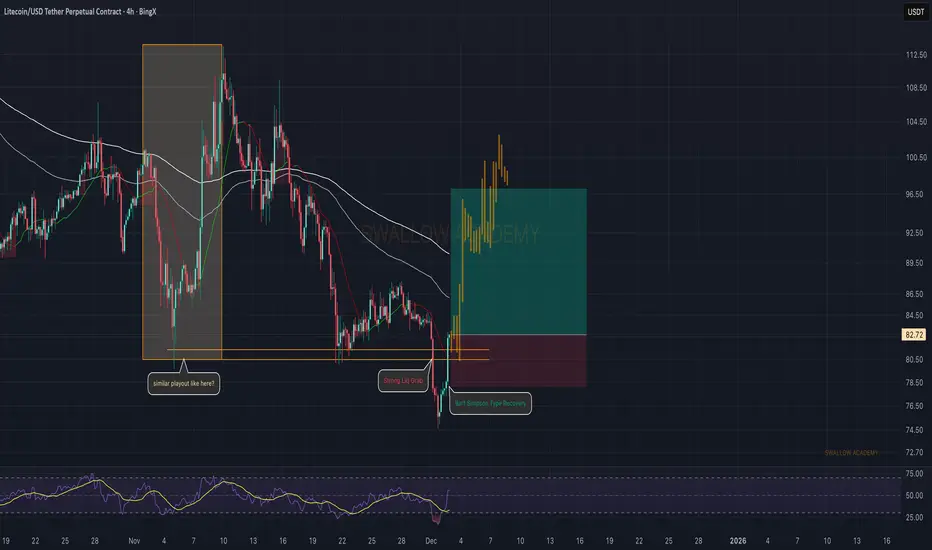
Litecoin (LTC): Seeing Similar Pattern | Bart Simpson PushLTC pulled a strong liquidity grab and instantly recovered with a classic Bart-Simpson type move — very similar to the playout we had earlier in November. If buyers manage to hold this recovery structure and keep pushing above the EMAs, we could see another upside leg forming the same way.
As long
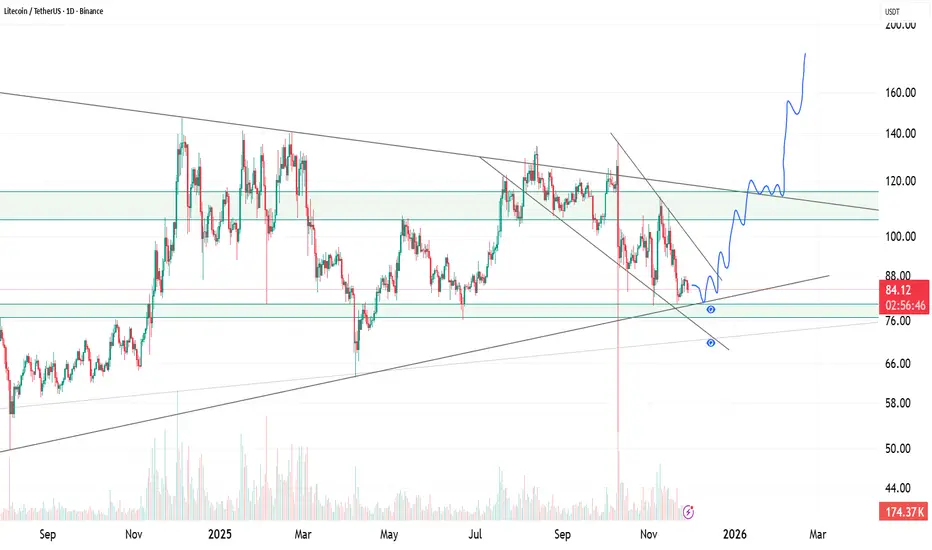
LTC , Retesting Major Support With a Potential Breakout SetupLTC is trading inside a long-term symmetrical wedge while also forming a smaller falling channel in the recent down-move. Price has reached a critical area where multiple technical factors overlap:
• A long-term ascending support trendline
• Horizontal support between $76–$82
• The lower boundary
FireHoseReel | LTC:When does Litecoin explode next?🔥 Welcome to FireHoseReel!
Let’s dive into the 4H Litecoin (LTC) analysis.
👀 Litecoin is currently trading below a descending curve trendline.
Each time price hits this curve, it gets rejected to the downside. Price is now approaching the end of this compression zone, while a key support has formed

Litecoin Below 70$ Soon.#Litecoin Below 70$ Soon...
After that it'll go for exit liquidity .
Be Safe Guys.

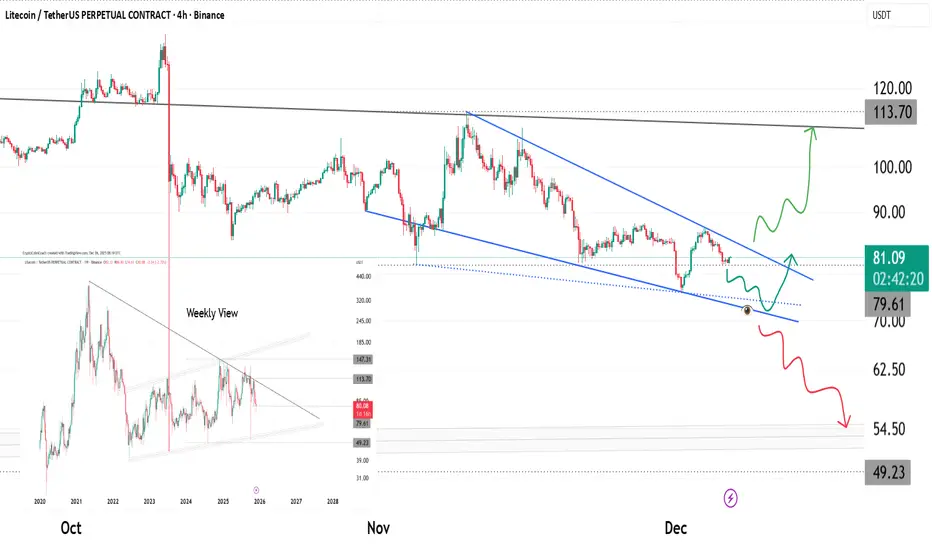
LTC: Final Compression Before the Break - Major Wedge EndingLitecoin is trading inside a clean falling wedge after multiple rejections from the macro trendline visible on the weekly chart. Price is now squeezing toward the apex with momentum flattening out.
Key notes:
• Bullish scenario: A breakout above the wedge resistance + reclaim of 85–87 opens ro
LTCUSDT swing tradeA simple setup for trading, here we should focus on range trading of support and resistance zones, the price reached the supp level where opening a long position may look very attractive, setting a stop loss beyond of support line, nothing complicated, just following basic fundamentals of trading, t

LITECOIN IS FULLY CHARGEDHey traders! LTC has been quietly accumulating energy in this tight range for days — all the coils are compressed, and the spring is about to pop!
I’m expecting a strong impulsive move upward very soon.
My targets:
🎯 Target 1 — 89
🎯 Target 2 — 91.20 (main zone I’m watching)
❌Invalidation (plan c

LTCUSDT LongConsolidation on H4 Chart, now price is on the bottom of pattern. Bullish signal is clear, Risk Reward 1:5

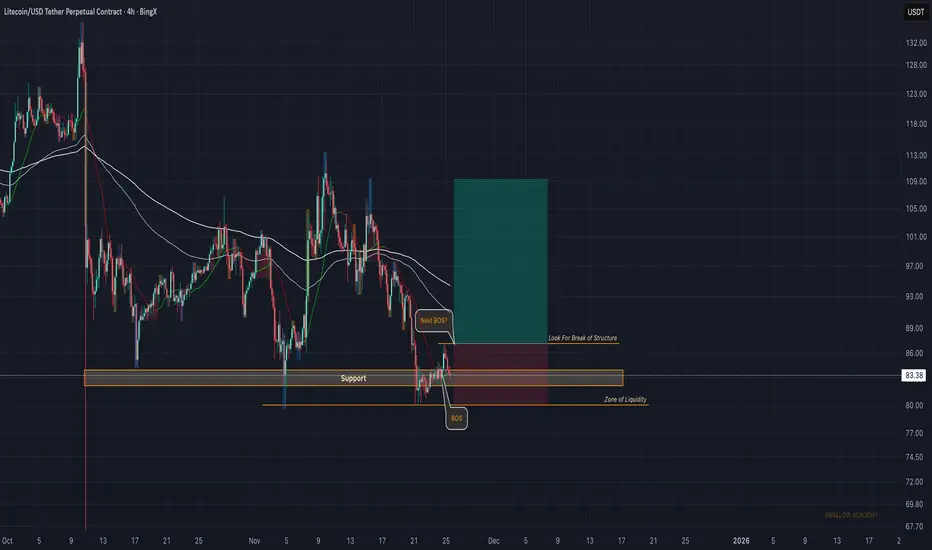
Litecoin (LTC): First BOS Formed, Now Looking For Second BOSLTC finally gave us the first BOS, which already flipped the short-term trend and showed that buyers are stepping in. Now we want to see a second BOS as confirmation — that’s the key signal that momentum is shifting properly in our favor.
If we get that second BOS, a long setup opens up with a good
See all ideas
Summarizing what the indicators are suggesting.
Oscillators
Neutral
SellBuy
Strong sellStrong buy
Strong sellSellNeutralBuyStrong buy
Oscillators
Neutral
SellBuy
Strong sellStrong buy
Strong sellSellNeutralBuyStrong buy
Summary
Neutral
SellBuy
Strong sellStrong buy
Strong sellSellNeutralBuyStrong buy
Summary
Neutral
SellBuy
Strong sellStrong buy
Strong sellSellNeutralBuyStrong buy
Summary
Neutral
SellBuy
Strong sellStrong buy
Strong sellSellNeutralBuyStrong buy
Moving Averages
Neutral
SellBuy
Strong sellStrong buy
Strong sellSellNeutralBuyStrong buy
Moving Averages
Neutral
SellBuy
Strong sellStrong buy
Strong sellSellNeutralBuyStrong buy
Displays a symbol's price movements over previous years to identify recurring trends.
Frequently Asked Questions
The current price of Litecoin / Tether USD (LTC) is 83.53 USDT — it has risen 1.17% in the past 24 hours. Try placing this info into the context by checking out what coins are also gaining and losing at the moment and seeing LTC price chart.
Litecoin / Tether USD price has fallen by −2.96% over the last week, its month performance shows a −5.45% decrease, and as for the last year, Litecoin / Tether USD has decreased by −39.10%. See more dynamics on LTC price chart.
Keep track of coins' changes with our Crypto Coins Heatmap.
Keep track of coins' changes with our Crypto Coins Heatmap.
Litecoin / Tether USD (LTC) reached its highest price on May 10, 2021 — it amounted to 413.60 USDT. Find more insights on the LTC price chart.
See the list of crypto gainers and choose what best fits your strategy.
See the list of crypto gainers and choose what best fits your strategy.
Litecoin / Tether USD (LTC) reached the lowest price of 22.18 USDT on Dec 8, 2018. View more Litecoin / Tether USD dynamics on the price chart.
See the list of crypto losers to find unexpected opportunities.
See the list of crypto losers to find unexpected opportunities.
The safest choice when buying LTC is to go to a well-known crypto exchange. Some of the popular names are Binance, Coinbase, Kraken. But you'll have to find a reliable broker and create an account first. You can trade LTC right from TradingView charts — just choose a broker and connect to your account.
Crypto markets are famous for their volatility, so one should study all the available stats before adding crypto assets to their portfolio. Very often it's technical analysis that comes in handy. We prepared technical ratings for Litecoin / Tether USD (LTC): today its technical analysis shows the sell signal, and according to the 1 week rating LTC shows the sell signal. And you'd better dig deeper and study 1 month rating too — it's sell. Find inspiration in Litecoin / Tether USD trading ideas and keep track of what's moving crypto markets with our crypto news feed.
Litecoin / Tether USD (LTC) is just as reliable as any other crypto asset — this corner of the world market is highly volatile. Today, for instance, Litecoin / Tether USD is estimated as 4.53% volatile. The only thing it means is that you must prepare and examine all available information before making a decision. And if you're not sure about Litecoin / Tether USD, you can find more inspiration in our curated watchlists.
You can discuss Litecoin / Tether USD (LTC) with other users in our public chats, Minds or in the comments to Ideas.