$LUNA/USDT ANALYSISOn the 1-day chart of **LUNA/USDT**, price recently broke out of a descending channel that had been forming since early October. The breakout candle closed strongly above the channel resistance with a noticeable surge in volume, confirming renewed bullish momentum after an extended downtrend. The br

LUNAUSDT Forming Falling WedgeLUNAUSDT is forming a clear falling wedge pattern, a classic bullish reversal signal that often indicates an upcoming breakout. The price has been consolidating within a narrowing range, suggesting that selling pressure is weakening while buyers are beginning to regain control. With consistent volum


LUNA OutlookRecently LUNA rose from $0.06 to $0.15. It is enough for now guys! Market didn't rise. Let's pump AXS (Axie Infinity) and ONE (Harmony) now. Thanks

#LUNA/USDT Bottom & Bullish Reversal#LUNA
The price is moving within a descending channel on the 1-hour frame, adhering well to it, and is heading for a strong breakout and retest.
We have a bearish trend on the RSI indicator that is about to be broken and retested, supporting the upside.
There is a major support area (in green) at

#LUNA Extended ! lONG Term#LUNA
The price is moving within a descending channel on the 1-hour frame, adhering well to it, and is heading for a strong breakout and retest.
We have a bounce from the lower boundary of the descending channel. This support is at 0.1480.
We have a downtrend on the RSI indicator that is about to

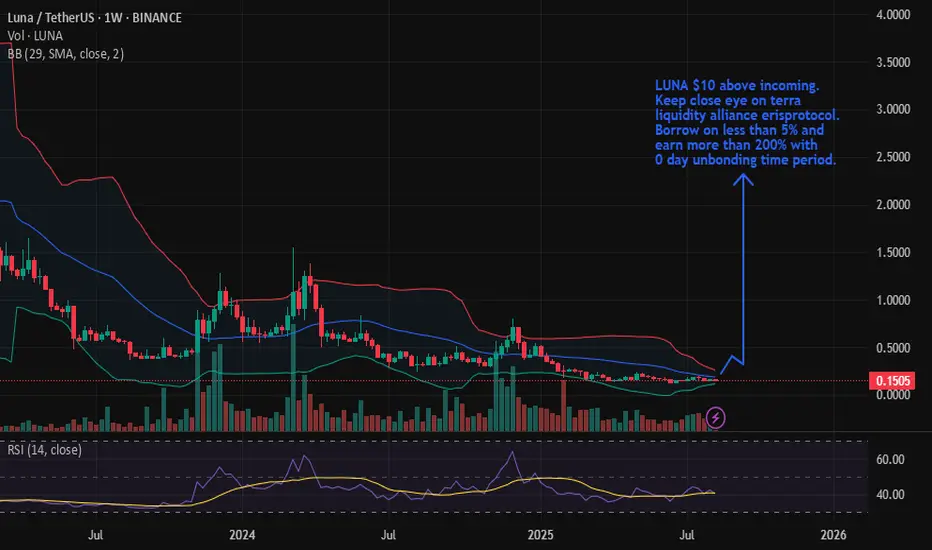
LUNA/USDT Terra liquidity alliance erisprotocol cosmos BreakoutTechnical Setup Favors Explosive Breakout strong buy signal EMA 20 50 100 200 are near divergence in 1week and 1 day chart.
Short squeeze incoming all short sellers futures will be liquidated which will accelerate upside.
Fundamentally:
LUNA consolidation is going on for a while but breakout is exp
LUNA/USDT crypto trading chart Breakout soon1. Technical Setup Favors Explosive Breakout
Moving Averages (Strong Buy Signal):
7/8 daily EMAs and SMAs (including critical 10-day, 21-day, and 50-day) show bullish alignment, with price trading above key averages. This indicates entrenched upward momentum.
Only the 200-day SMA ($0.23) act

luna long positionin my opinion this is a good trade with a good r/r
hope hit the tp
consider this is my trade not your trade and i just like to share my trades with world

LUNA terra liquidity alliance erisprotocol APR Breakout soonLUNA has been consolidated for a while. LUNA 1 week trading chart is showing a massive bull pattern, which could trigger at any moment. EMA 20, 50, 100, and 200 are hinting at signals for a massive breakout in the coming weeks or much sooner.
Hundreds more dapps and many services are in the pipelin
See all ideas
Summarizing what the indicators are suggesting.
Oscillators
Neutral
SellBuy
Strong sellStrong buy
Strong sellSellNeutralBuyStrong buy
Oscillators
Neutral
SellBuy
Strong sellStrong buy
Strong sellSellNeutralBuyStrong buy
Summary
Neutral
SellBuy
Strong sellStrong buy
Strong sellSellNeutralBuyStrong buy
Summary
Neutral
SellBuy
Strong sellStrong buy
Strong sellSellNeutralBuyStrong buy
Summary
Neutral
SellBuy
Strong sellStrong buy
Strong sellSellNeutralBuyStrong buy
Moving Averages
Neutral
SellBuy
Strong sellStrong buy
Strong sellSellNeutralBuyStrong buy
Moving Averages
Neutral
SellBuy
Strong sellStrong buy
Strong sellSellNeutralBuyStrong buy
Displays a symbol's price movements over previous years to identify recurring trends.