KEEP AN EYE ON MANTAOn November 17, 2025, Bifrost launched vMANTA 2.0, enabling cross-chain staking between Ethereum and Manta Pacific with a 20.16% APY. This followed Manta’s October 28 mainnet staking integration with Symbiotic. Technical Rebound Possible due to strong technicals
MANTAUSDT Forming Falling WedgeMANTA/USDT is setting up a very interesting technical picture — price is contracting into what looks like a falling-wedge formation, which often signals a potential bullish reversal. The tightening range, combined with volume that’s beginning to pick back up, suggests that accumulation could be buil
MANTAUSDT UPDATE#MANTA
UPDATE
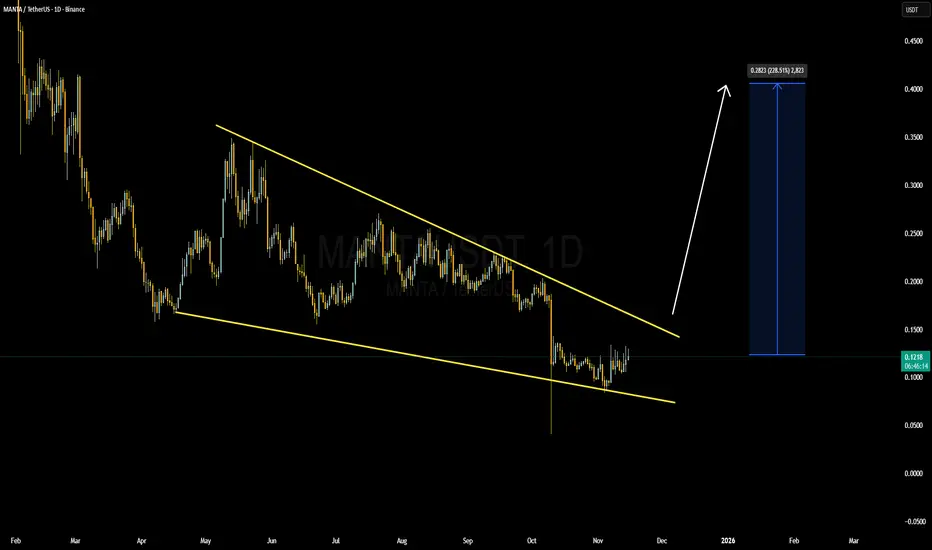
MANTA Technical Setup
Pattern: Falling wedge pattern
Current Price: $0.1216
Target Price: $0.2807
Target % Gain: 100.07%
Technical Analysis: MANTA is breaking out of a falling wedge pattern on the 1D chart, showing early bullish momentum as price pushes above short-term resistance
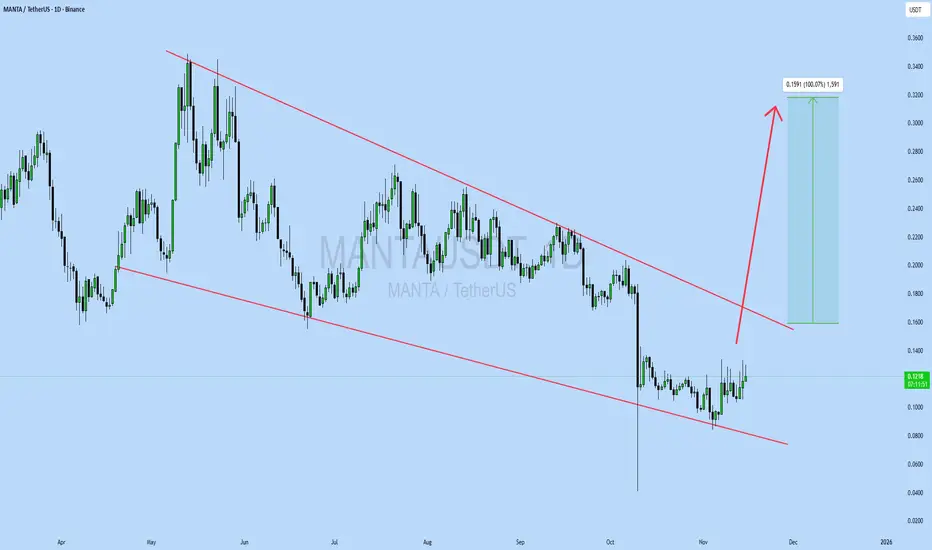
MANTAUSDT 1D#MANTA is moving inside a falling wedge pattern on the daily chart. It is currently facing resistance from the Ichimoku cloud. Volume has increased, which is a positive sign. If the price breaks out above the Ichimoku cloud and the wedge resistance, the potential upside targets are:
🎯 $0.1508
🎯 $0.

MANTA: $0.11Understanding the mind of Smart Money
at artficial depression
with a project designed as robust as Matic Celestia
and the next best alternative to whatever chain is mainstream
low cost
under the custody of Gang of 8

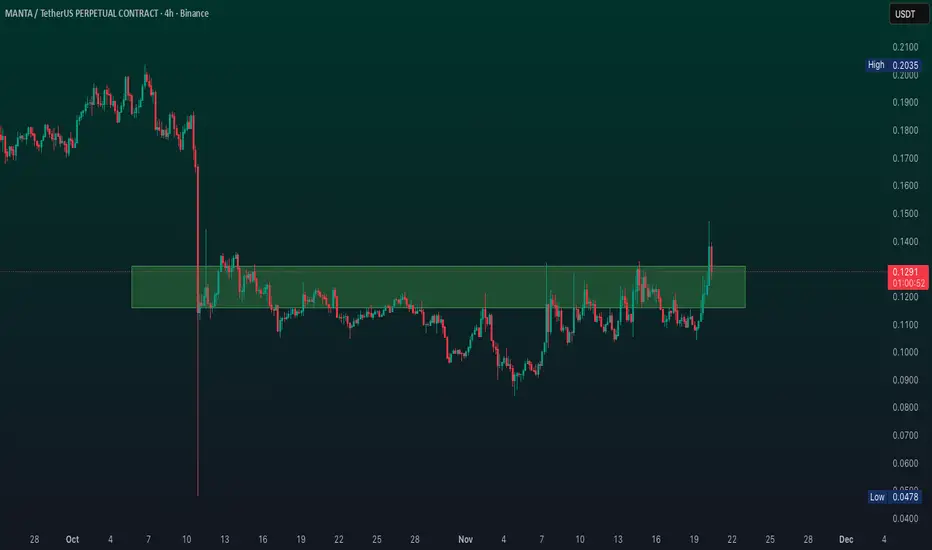
MANTAUSDT Bullish Channel Breakout!MANTA is showing a potential bullish breakout from a descending channel that has been holding price down throughout October. The recent strong recovery and breakout attempt above the upper trendline indicate early signs of trend reversal and possible momentum shift to the upside.
Key Points:
-Pr

#MANTA/USDT – Bullish Setup Alert ?#MANTA
The price is moving within a descending channel on the 1-hour frame and is expected to break and continue upward.
We have a trend to stabilize above the 100 moving average once again.
We have a downtrend on the RSI indicator that supports the upward break.
We have a support area at the lo

MANTA - SUPER BULLISH LONG SET-UPBINANCE:MANTAUSDT
Entry: ~$0.21
Stop-loss: ~$0.14
Targets: $0.60 (1st), $1.30 (2nd)
Upside: ~500% potential
Risk/Reward: Very favorable if breakout holds

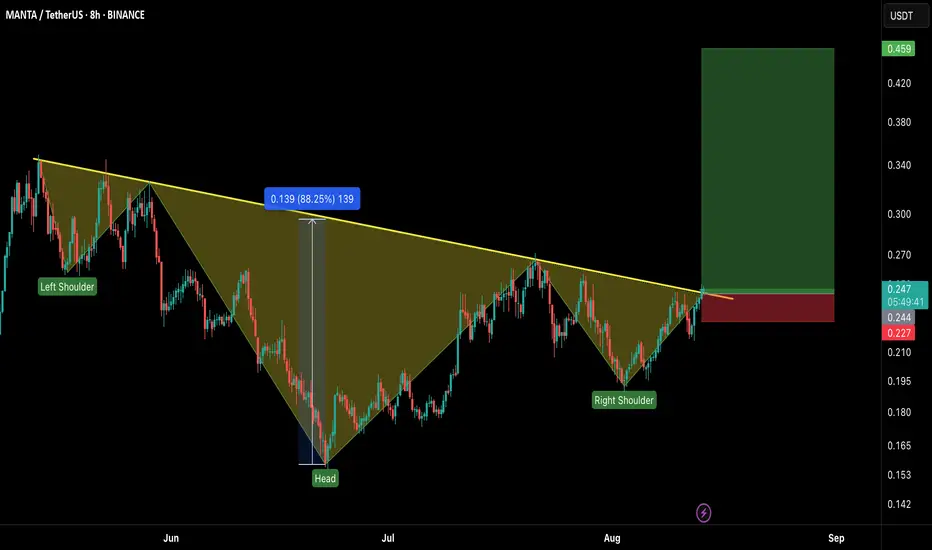
MANTA/USDT – Long Setup Alert!MANTA has just broken out of a massive Inverse Head & Shoulders pattern on the 8H chart — a bullish reversal signal that could ignite a strong upside rally. 📈
Setup Details:
Entry: CMP – 0.248
Stop Loss: 0.227 (below neckline retest)
Targets:
🎯 TP1: 0.34
🎯 TP2: 0.42
🎯 TP3: 0.459
Leverage: 5x max (
MANTAUSDT 1D#MANTA has broken above the descending resistance on the daily chart, and the retest has been successfully completed. It is now facing the daily SMA100.
In case of a breakout above it, the targets are:
🎯 $0.269
🎯 $0.338
🎯 $0.393
🎯 $0.448
🎯 $0.527
🎯 $0.628
⚠️ As always, use a tight stop-loss and ap

See all ideas
Summarizing what the indicators are suggesting.
Oscillators
Neutral
SellBuy
Strong sellStrong buy
Strong sellSellNeutralBuyStrong buy
Oscillators
Neutral
SellBuy
Strong sellStrong buy
Strong sellSellNeutralBuyStrong buy
Summary
Neutral
SellBuy
Strong sellStrong buy
Strong sellSellNeutralBuyStrong buy
Summary
Neutral
SellBuy
Strong sellStrong buy
Strong sellSellNeutralBuyStrong buy
Summary
Neutral
SellBuy
Strong sellStrong buy
Strong sellSellNeutralBuyStrong buy
Moving Averages
Neutral
SellBuy
Strong sellStrong buy
Strong sellSellNeutralBuyStrong buy
Moving Averages
Neutral
SellBuy
Strong sellStrong buy
Strong sellSellNeutralBuyStrong buy
Displays a symbol's price movements over previous years to identify recurring trends.