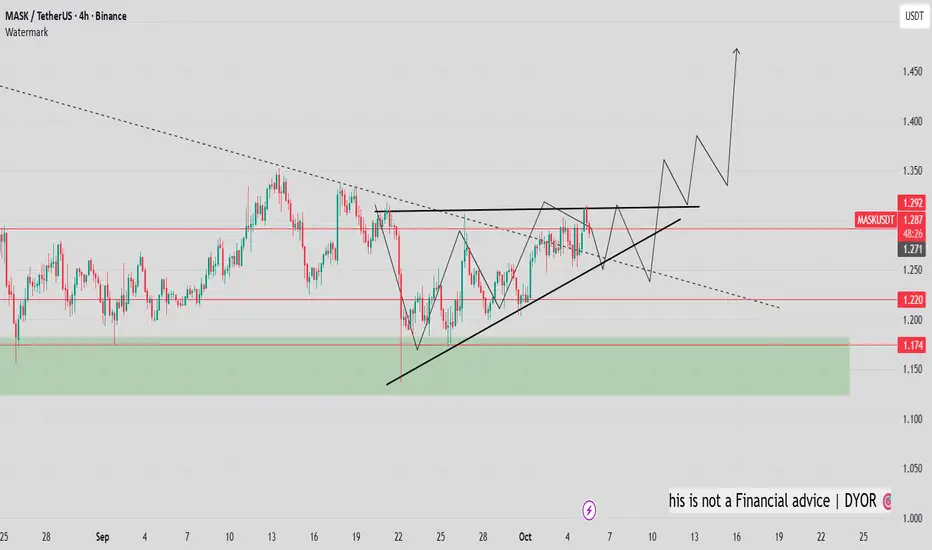
$MASK - bullish breakout awaited! NASDAQ:MASK - bullish setup - long term accumulation 📈
Prices looks set to fly. Matters of days 🚀, or weeks?
110 days accumulation above green zone.
I see a nice ascending channel above the uptrend.
Shakout and bearll trap possible if we grab liquidities around 1.250 - 1.240$ demand zone.
MASKUSDT 1D#MASK is moving inside a descending triangle pattern on the daily timeframe. It is currently facing the triangle resistance and the daily SMA100. In case of a breakout above both, the potential targets are:
🎯 $1.411
🎯 $1.507
🎯 $1.602
🎯 $1.738
🎯 $1.911
⚠️ Always remember to use a tight stop-loss an

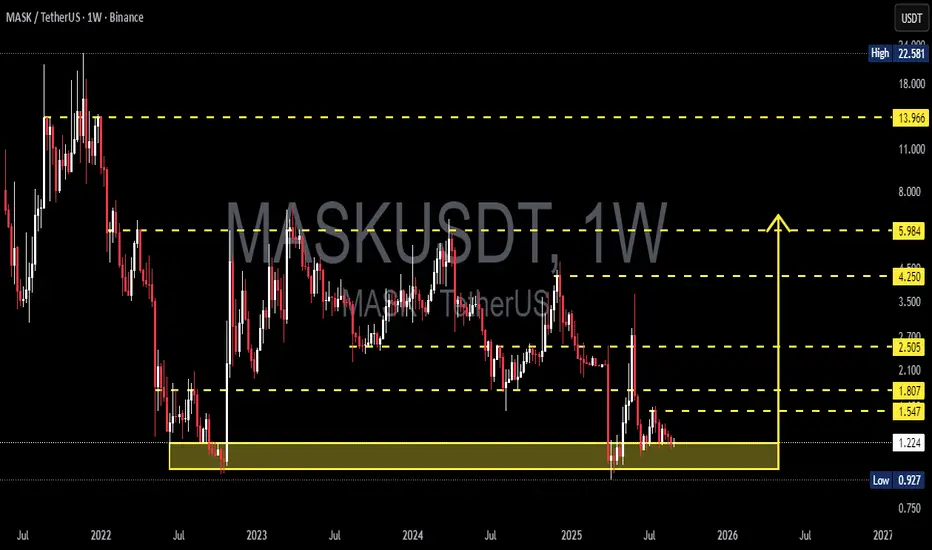
MASK/USDT — Testing Big Support! Big Rebound or Major Breakdown?
🔎 Overall Analysis
MASK is once again testing the historical support zone at 0.93 – 1.22 USDT (yellow box), an area that has repeatedly acted as a demand zone since 2022. Each time price revisited this region, it sparked strong rebounds.
However, the long-term structure remains bearish with a cle
$mask reclaiming 50 ema on D1
assuming we may wick below before weekly close but recon we good for $3plus quickish
rsi popping up dominance nuking

MASKUSDT - SELLERS ARE IN CONTROLChart shows interesting pumps and dumps, but buyers still haven’t stepped in. The strongest selling area is marked with a black box where sellers remain in control.
Watching how price reacts if it returns there: if sellers stay strong, no trade; if we see footprint absorption + CDV divergence + st

MASK Analysis (3D)The correction for MASK has started from the area marked as “Strat” on the chart.
This appears to be forming a symmetrical correction, and we seem to be approaching the end of wave I.
The green zone is considered the most favorable and low-risk area for the completion of wave I.
Targets are indic

MASKUSDT 1W AnalysisMASK ~ 1W Analysis
#MASK Buy back gradually from here if you still have confidence in this coin with a short term target of at least 20%+ from this support.

I believe Mask will go bullish up to 50% this week!Mask analysis:
Price has broken the support area and retested it. There is a downtrend line acting as a resistance area. This is a no-trading zone, and we will open new positions only if the price is able to break above the downtrend line.
Resistance Area: $1.8-56

MASK – Critical Trendline Retest and Next MoveMASK is clinging to the descending trendline on the daily chart after a tough rejection on the 4-hour timeframe and a steep 40% drop 📉. This level could be the springboard for a reversal move 🚀, or if it fails, it may open the door to more downside action. Keep an eye on this zone — the next move co

maskIt has formed a good bottom
But there are many obstacles in its way to throw
The first step is the red box for now
And the most important support that I see now is these two green lines. So for now, be careful not to allow it to drain liquidity until the red box is broken

See all ideas
Summarizing what the indicators are suggesting.
Oscillators
Neutral
SellBuy
Strong sellStrong buy
Strong sellSellNeutralBuyStrong buy
Oscillators
Neutral
SellBuy
Strong sellStrong buy
Strong sellSellNeutralBuyStrong buy
Summary
Neutral
SellBuy
Strong sellStrong buy
Strong sellSellNeutralBuyStrong buy
Summary
Neutral
SellBuy
Strong sellStrong buy
Strong sellSellNeutralBuyStrong buy
Summary
Neutral
SellBuy
Strong sellStrong buy
Strong sellSellNeutralBuyStrong buy
Moving Averages
Neutral
SellBuy
Strong sellStrong buy
Strong sellSellNeutralBuyStrong buy
Moving Averages
Neutral
SellBuy
Strong sellStrong buy
Strong sellSellNeutralBuyStrong buy
Displays a symbol's price movements over previous years to identify recurring trends.