Natural Gas Futures
Sorry, this is only available to registered users
MCX provides data to our registered users only, so to get it you'll need to sign up for a TradingView account.
Contract highlights
Related commodities

Nat Gas; Dip then RipA slight breather as expected for NG prices after such a strong reversal, from the storage report lows on 6/27/2025. Support for NG based on volume looks to be in the $3.55 to $3.65 range, before continuing a move up to $4+. NYMEX:NG1!

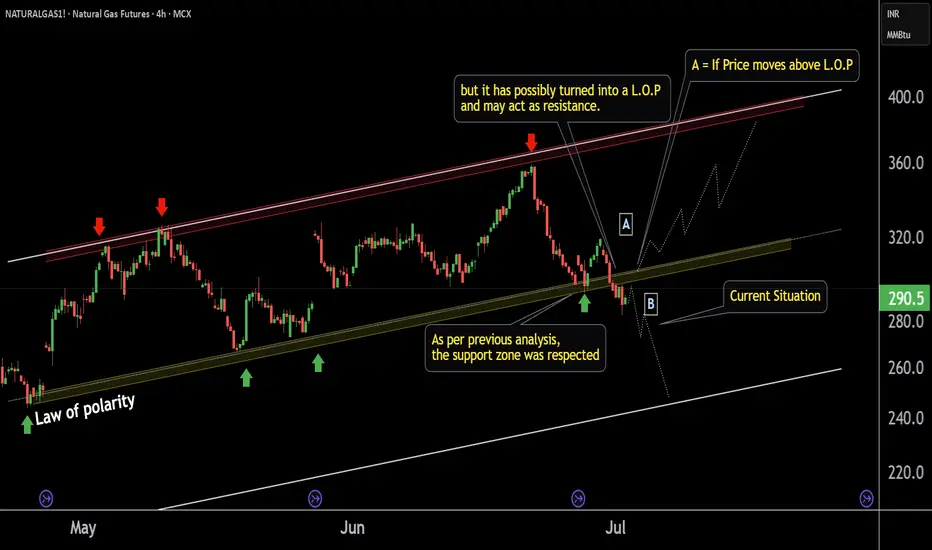
NATURALGAS at Best Support Zone This is the 4 hour chart of Natural Gas.
Natural Gas having a good Support Zone at 290-295 range.
Natural Gas has shown a reversal from its support zone.
Natural Gas is trading within a parallel channel support at 293 level Natural Gas.
Thank You !!

NATURALGAS1! Short time Breadkdown Alert !!This is the 4 hour chart of Natural Gas Futures.
NATURALGAS1 has given a short-term channel breakdown; the previous support may now possibly act as resistance at 300 level.
The breakdown target is the lower boundary of the broader channel, which may now act as support near at 240 level.
If lop is
NG1! BEARS ARE GAINING STRENGTH|SHORT
NG1! SIGNAL
Trade Direction: short
Entry Level: 3.737
Target Level: 3.205
Stop Loss: 4.089
RISK PROFILE
Risk level: medium
Suggested risk: 1%
Timeframe: 1D
Disclosure: I am part of Trade Nation's Influencer program and receive a monthly fee for using their TradingView charts in my analysis.
✅L

Natural Gas Slips Below Support – More Downside Ahead ?
Recent candles are large-bodied bearish candles, indicating strong selling pressure.
Bollinger Basis is sloping downward, showing short-term bearish momentum.
Price is currently below both the 20-day and 50-day moving averages, reinforcing the bearish outlook.

NATGAS: Forecast & Trading Plan
The analysis of the NATGAS chart clearly shows us that the pair is finally about to tank due to the rising pressure from the sellers.
Disclosure: I am part of Trade Nation's Influencer program and receive a monthly fee for using their TradingView charts in my analysis.
❤️ Please, support our wo

NATURALGAS1! 's key Level |This is the 4 hour chart of NATURALGAS1!
NATURALGAS1! has once again started sustaining above
its LOP (Law of Polarity) zone near at 290-295
If This level is sustain then ,we may see higher prices again in NATURALGAS1!.
Thank You !!

Natural Gas Long positionNatural Gas will be ready for LONG position from 295 to 297 Labels, be ready to catch the move till 395 and above..........

NATGAS Long setupIf you like my Idea, Don't forget to Boost and comment on my Analysis. The recommendations are purely for educational purpose only, consult you financial advisor before trading.

See all ideas
A representation of what an asset is worth today and what the market thinks it will be worth in the future.
Sorry, this is only available to registered users
MCX provides data to our registered users only, so to get it you'll need to sign up for a TradingView account.
Displays a symbol's price movements over previous years to identify recurring trends.
Frequently Asked Questions
The nearest expiration date for Natural Gas Futures is Jul 26, 2023.
Traders prefer to sell futures contracts when they've already made money on the investment, but still have plenty of time left before the expiration date. Thus, many consider it a good option to sell Natural Gas Futures before Jul 26, 2023.