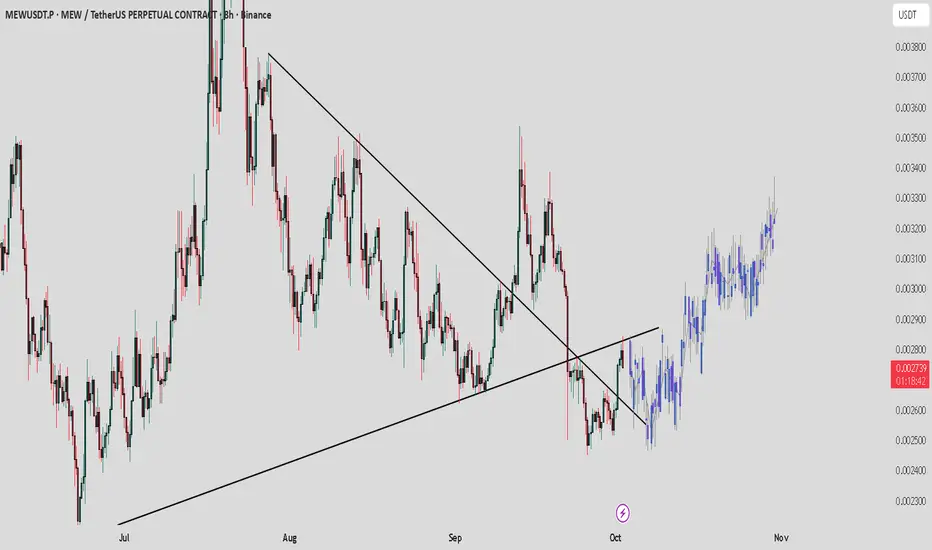
MEW / USDT : Bullish setup , Watching retest for next leg upMEW / USDT Breakout confirmed from the descending trendline. Price is retesting the demand zone, and as long as this support holds, we can expect bullish continuation towards higher levels. Breakdown below the zone will invalidate the setup.
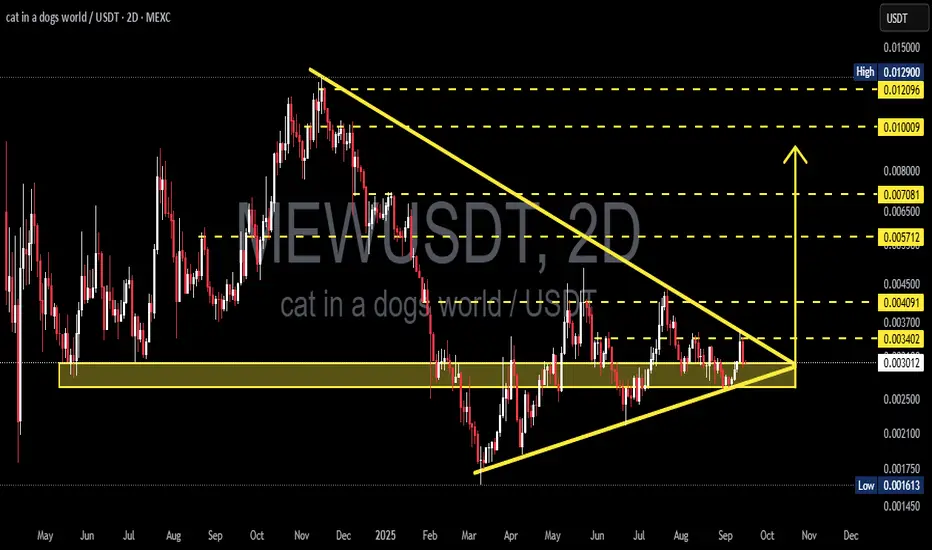
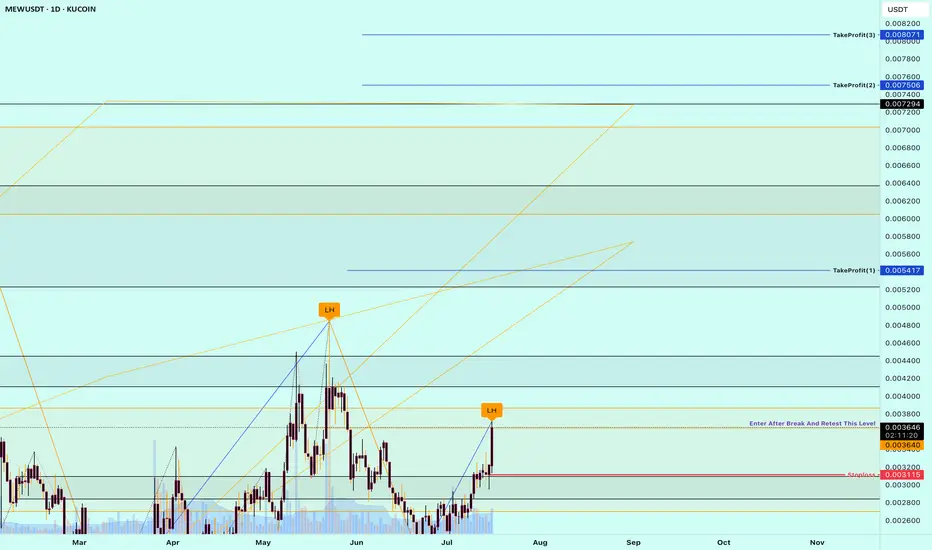
MEWUSDT 1D#MEW is moving within a symmetrical triangle on the daily chart and is currently sitting on the daily SMA200. In case of a bounce, we can expect it to move toward the triangle resistance and potentially break above it. If that happens, the targets are:
🎯 $0.003647
🎯 $0.004104
🎯 $0.004797
Mid-term

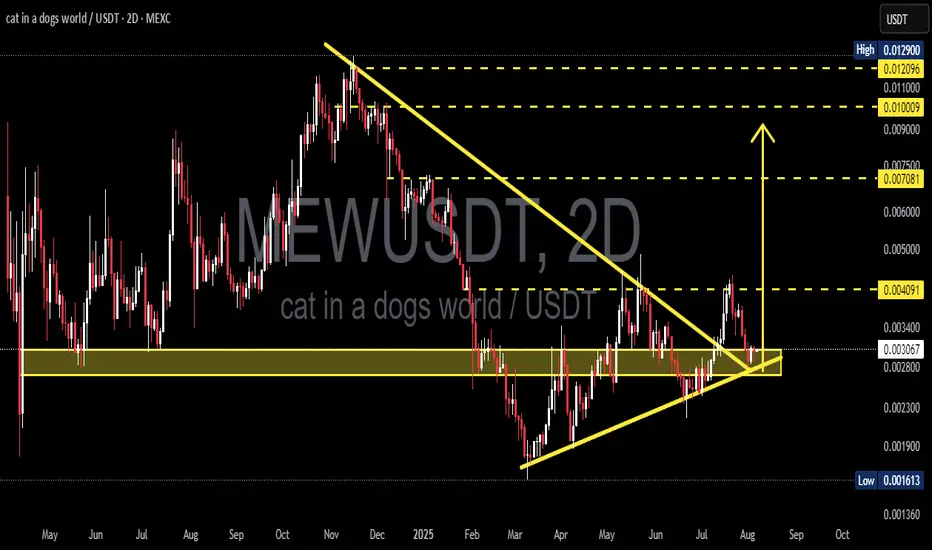
MEWU/USDT — Symmetrical Triangle: A Major Breakout is Coming?📝 Summary
The MEWU/USDT pair is currently consolidating after a strong downtrend since early 2025. Price has been compressing into a symmetrical triangle pattern, trapped between a horizontal support zone at 0.0027–0.0033 and a descending resistance trendline.
The structure is now very close to its
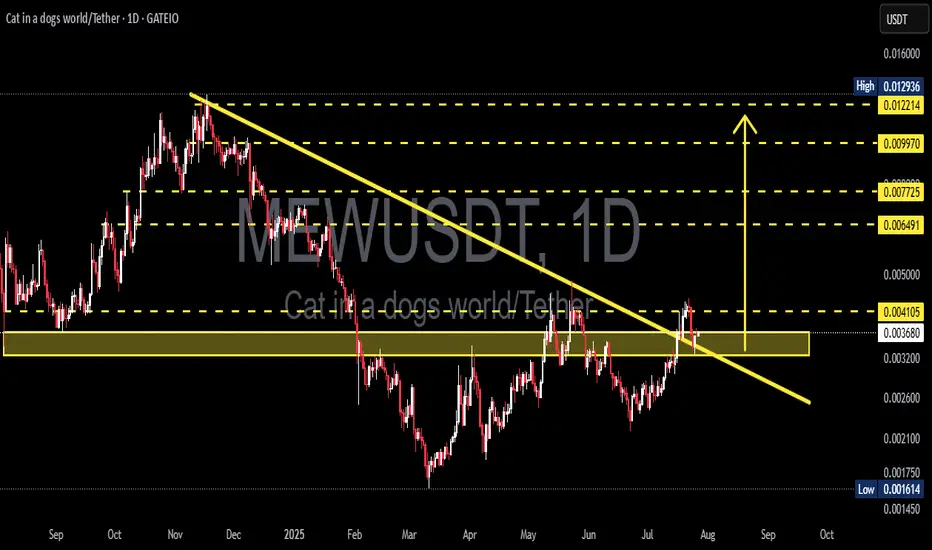
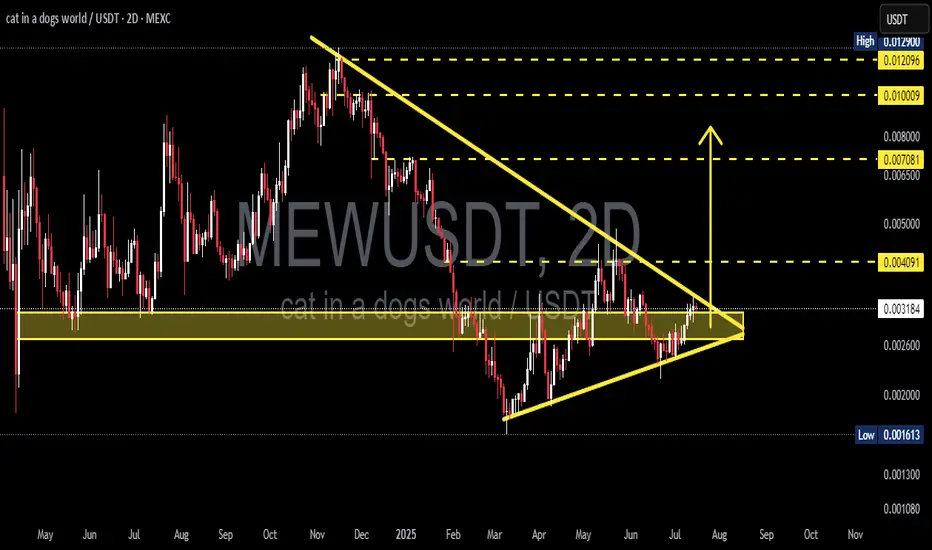
MEW/USDT Retesting Key Zone, Ready for the Next Move?📊 Technical Analysis:
MEW/USDT on the 2D timeframe shows a compelling structure with a Symmetrical Triangle pattern breakout that occurred in late July 2025. This breakout indicates a potential trend reversal from bearish to bullish.
Currently, the price is performing a retest of the breakout leve
mew usdt looking good1. on the daily we are consolidating in a cup and handle we are right at the 200ma if we break above it we should get a move
2 on the weekly time frame its making higher lows with bullish divergence
3 most of the time frames have had time to cool down over sold, i would enter close to the point of c

MEW : A meme coin that hasn't grown yetHello friends🙌
Given the decline we had, you can see that buyers entered the specified support area and entered the price into the ascending channel. That is why we can buy with risk and capital management and stay with it until the specified targets.
🔥Follow us for more signals🔥
*Trade safely w

MEWUSDT Breakout! Rounded Bottom Reversal and Key Retest Zone!MEWUSDT has officially broken out of a long-term descending trendline that has capped price action since December 2024. The formation of a Rounded Bottom (Cup) suggests a strong accumulation phase and potential for trend reversal. The current retest of the breakout zone will be crucial in determinin
MEW - 7/20/2025Clear weekly momentum pushing upwards out of long term downtrend.
Think we're set up for a marketwide breakout soon anyways.
nfa :)

Buy Trade Strategy for MEW: Tapping Into the Meme Economy SurgeDescription:
This trading idea focuses on MEW, a rising star in the meme coin category that’s capturing community attention through strong online engagement and viral appeal. Unlike traditional cryptocurrencies, MEW leverages the power of internet culture and social media dynamics to drive visibili
MEW/USDT Ready to Explode? Major Breakout from Symmetrical!After weeks of tight consolidation, MEW/USDT is showing signs of a major breakout from a well-formed Symmetrical Triangle pattern on the 2D time frame. This could mark the beginning of a powerful expansion phase if confirmed by volume and price action.
🔍 Pattern Analysis & Technical Structure
Mai
See all ideas
Summarizing what the indicators are suggesting.
Oscillators
Neutral
SellBuy
Strong sellStrong buy
Strong sellSellNeutralBuyStrong buy
Oscillators
Neutral
SellBuy
Strong sellStrong buy
Strong sellSellNeutralBuyStrong buy
Summary
Neutral
SellBuy
Strong sellStrong buy
Strong sellSellNeutralBuyStrong buy
Summary
Neutral
SellBuy
Strong sellStrong buy
Strong sellSellNeutralBuyStrong buy
Summary
Neutral
SellBuy
Strong sellStrong buy
Strong sellSellNeutralBuyStrong buy
Moving Averages
Neutral
SellBuy
Strong sellStrong buy
Strong sellSellNeutralBuyStrong buy
Moving Averages
Neutral
SellBuy
Strong sellStrong buy
Strong sellSellNeutralBuyStrong buy
Displays a symbol's price movements over previous years to identify recurring trends.