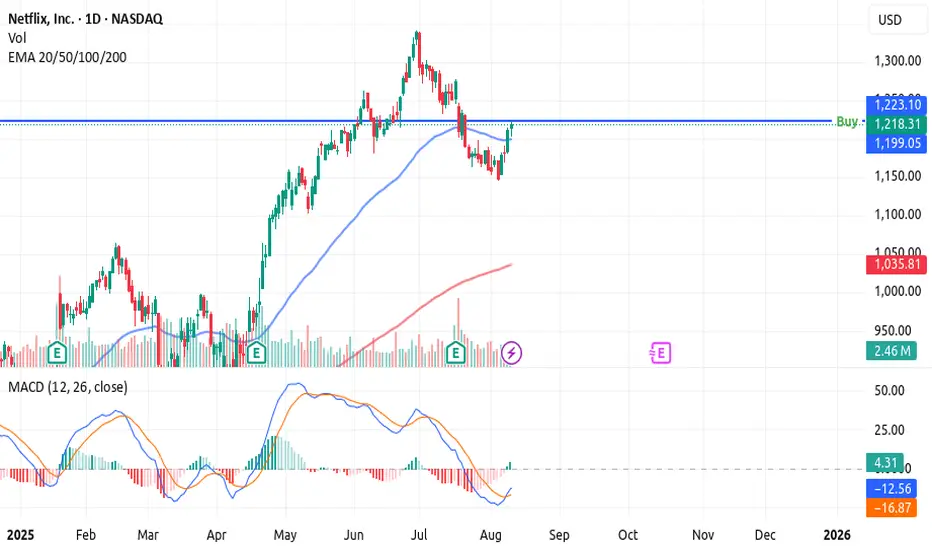
Netflix Bullish StanceBreaking above the $1,200 psychological level
Strong earnings growth (47% YoY for Q2)
Technical indicators supporting the bullish stance (Alligator, Stochastic crossover, pSAR)
Key Fibonacci levels providing support and resistance targets
Positive volume pattern suggesting accumulation
Key facts today
Next report date
—
Report period
—
EPS estimate
—
Revenue estimate
—
20.4 EUR
8.42 B EUR
37.55 B EUR
422.14 M
About Netflix, Inc.
Sector
Industry
Website
Headquarters
Los Gatos
Founded
1997
FIGI
BBG00J7BK316
Netflix, Inc. engages in providing entertainment services. It also offers activities for leisure time, entertainment video, video gaming, and other sources of entertainment. It operates through the United States and International geographic segments. The company was founded by Marc Randolph and Wilmot Reed Hastings on August 29, 1997 and is headquartered in Los Gatos, CA.
Related stocks

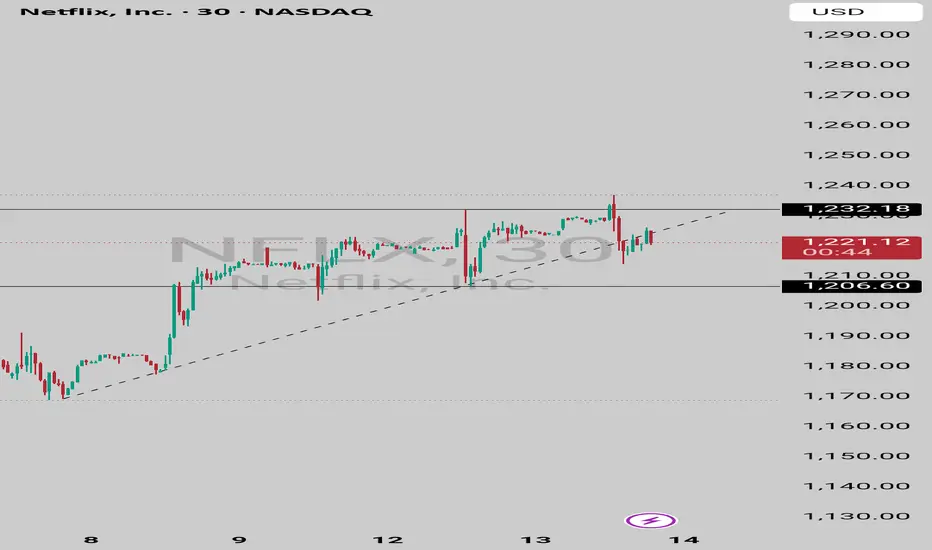
(Netflix, Inc. – 2H timeframe, NASDAQ)(Netflix, Inc. – 2H timeframe, NASDAQ),
Current price: ~1245 USD
Breakout zone: 1240–1245 USD (holding above support now)
First target: ~1292 USD
Second target: ~1340 USD
📈 So, my chart suggests:
Immediate target: 1290–1295 USD
Extended target: 1340 USD if momentum continues

This is A 3 Month Move Using This 3-Step StrategyThis is a 3 month move that you need to prepare for.
But you have to remember something.
Volatility is a must.
Even if you try to be as accurate as possible.
Yes i know you want to make money the safe way which is okay.
But you have to account for risk.
This is why risk management is very importan
Netflix future moves on one hour frame based on my analysis on geometry trading here is how I see Netflix will do in the near future on one hour time frame
thanks

NFLX is coasting right into the earnings drop zoneI'm taking a chill pill and watching to see what price will do at this area. This is where the post earning drop happened. Are we strengthening to ride higher or nah?
Neutral eye looking for bearish setups myself. What about you?

NFLXNot looking good in my opinion its already breakdown the trendline. Also we have support below this trendline maybe it gonna retest it and bounce again.
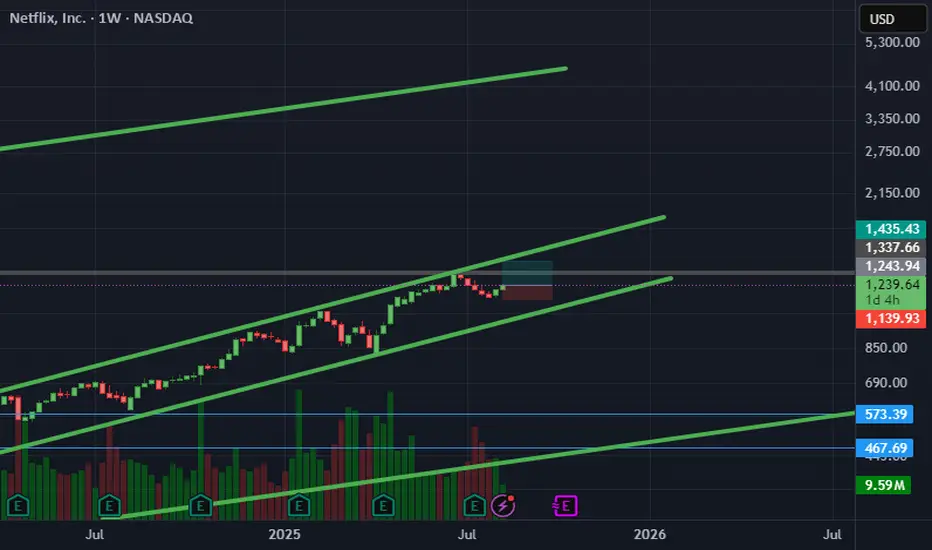
NFLX - a wild ride - hold on tight??This longer term EW count would suggest that we may be looking for a 4th wave correction in this stock in the shorter term while still expecting some decent upside going forward. I have used logarithmic scales for fib measurements.

Netflix Mini Pullback into LongNetflix can be setting up for a potential ABC correction, into the 1-1 extension on tech sector weakness and potential profit taking.
I am watching this stock for a potential buy zone at the lower end of the target, which would be a nice place for a longer term s/r structural flip for further cont

New Setup : NFLXThe current pullback should be over after the most recend crossover.
We are ready to catch both actions, but right now the bullish scenario is more plausible.
Ready !

See all ideas
Summarizing what the indicators are suggesting.
Neutral
SellBuy
Strong sellStrong buy
Strong sellSellNeutralBuyStrong buy
Neutral
SellBuy
Strong sellStrong buy
Strong sellSellNeutralBuyStrong buy
Neutral
SellBuy
Strong sellStrong buy
Strong sellSellNeutralBuyStrong buy
An aggregate view of professional's ratings.
Neutral
SellBuy
Strong sellStrong buy
Strong sellSellNeutralBuyStrong buy
Neutral
SellBuy
Strong sellStrong buy
Strong sellSellNeutralBuyStrong buy
Neutral
SellBuy
Strong sellStrong buy
Strong sellSellNeutralBuyStrong buy
Displays a symbol's price movements over previous years to identify recurring trends.
NFLX5862368
Netflix, Inc. 5.4% 15-AUG-2054Yield to maturity
—
Maturity date
Aug 15, 2054
NFLX4826528
Netflix, Inc. 5.875% 15-NOV-2028Yield to maturity
—
Maturity date
Nov 15, 2028
NFLX5862367
Netflix, Inc. 4.9% 15-AUG-2034Yield to maturity
—
Maturity date
Aug 15, 2034
NFLX4764899
Netflix, Inc. 4.875% 15-APR-2028Yield to maturity
—
Maturity date
Apr 15, 2028
NFLX4901374
Netflix, Inc. 4.875% 15-JUN-2030Yield to maturity
—
Maturity date
Jun 15, 2030
NFLX4908613
Netflix, Inc. 6.375% 15-MAY-2029Yield to maturity
—
Maturity date
May 15, 2029
XS198938017
NETFLIX 19/29 REGSYield to maturity
—
Maturity date
Nov 15, 2029
US64110LAN64
NETFLIX 4.375% CALL 15NV26Yield to maturity
—
Maturity date
Nov 15, 2026
XS198938050
NETFLIX 19/29 144AYield to maturity
—
Maturity date
Nov 15, 2029
USU74079AN1
NETFLIX 19/29 REGSYield to maturity
—
Maturity date
Nov 15, 2029
XS207282979
NETFLIX INC. 19/30 REGSYield to maturity
—
Maturity date
Jun 15, 2030
See all 1NFLX bonds
Curated watchlists where 1NFLX is featured.


Frequently Asked Questions
The current price of 1NFLX is 1,030.6 EUR — it has decreased by −1.04% in the past 24 hours. Watch NETFLIX stock price performance more closely on the chart.
Depending on the exchange, the stock ticker may vary. For instance, on MIL exchange NETFLIX stocks are traded under the ticker 1NFLX.
1NFLX stock has fallen by −0.02% compared to the previous week, the month change is a 1.44% rise, over the last year NETFLIX has showed a 65.00% increase.
We've gathered analysts' opinions on NETFLIX future price: according to them, 1NFLX price has a max estimate of 1,378.61 EUR and a min estimate of 717.74 EUR. Watch 1NFLX chart and read a more detailed NETFLIX stock forecast: see what analysts think of NETFLIX and suggest that you do with its stocks.
1NFLX reached its all-time high on Jun 30, 2025 with the price of 1,140.2 EUR, and its all-time low was 155.8 EUR and was reached on May 12, 2022. View more price dynamics on 1NFLX chart.
See other stocks reaching their highest and lowest prices.
See other stocks reaching their highest and lowest prices.
1NFLX stock is 1.64% volatile and has beta coefficient of 1.24. Track NETFLIX stock price on the chart and check out the list of the most volatile stocks — is NETFLIX there?
Today NETFLIX has the market capitalization of 441.06 B, it has increased by 1.71% over the last week.
Yes, you can track NETFLIX financials in yearly and quarterly reports right on TradingView.
NETFLIX is going to release the next earnings report on Oct 15, 2025. Keep track of upcoming events with our Earnings Calendar.
1NFLX earnings for the last quarter are 6.10 EUR per share, whereas the estimation was 6.00 EUR resulting in a 1.75% surprise. The estimated earnings for the next quarter are 5.97 EUR per share. See more details about NETFLIX earnings.
NETFLIX revenue for the last quarter amounts to 9.41 B EUR, despite the estimated figure of 9.39 B EUR. In the next quarter, revenue is expected to reach 9.93 B EUR.
1NFLX net income for the last quarter is 2.65 B EUR, while the quarter before that showed 2.67 B EUR of net income which accounts for −0.69% change. Track more NETFLIX financial stats to get the full picture.
No, 1NFLX doesn't pay any dividends to its shareholders. But don't worry, we've prepared a list of high-dividend stocks for you.
As of Aug 24, 2025, the company has 14 K employees. See our rating of the largest employees — is NETFLIX on this list?
EBITDA measures a company's operating performance, its growth signifies an improvement in the efficiency of a company. NETFLIX EBITDA is 23.69 B EUR, and current EBITDA margin is 66.68%. See more stats in NETFLIX financial statements.
Like other stocks, 1NFLX shares are traded on stock exchanges, e.g. Nasdaq, Nyse, Euronext, and the easiest way to buy them is through an online stock broker. To do this, you need to open an account and follow a broker's procedures, then start trading. You can trade NETFLIX stock right from TradingView charts — choose your broker and connect to your account.
Investing in stocks requires a comprehensive research: you should carefully study all the available data, e.g. company's financials, related news, and its technical analysis. So NETFLIX technincal analysis shows the sell today, and its 1 week rating is buy. Since market conditions are prone to changes, it's worth looking a bit further into the future — according to the 1 month rating NETFLIX stock shows the buy signal. See more of NETFLIX technicals for a more comprehensive analysis.
If you're still not sure, try looking for inspiration in our curated watchlists.
If you're still not sure, try looking for inspiration in our curated watchlists.