MILKUSDT ANALYSIS
CBOE:MILK Analysis 💹
CBOE:MILK is currently consolidating inside a tight bullish box, showing signs of accumulation and steady buying interest. The structure looks clean and ready for a potential breakout in the coming sessions. 📦📈
I’ve entered a long position within this range, planning to add more on any dips as long as price holds the box support. A confirmed breakout above the upper boundary could trigger a strong upside leg with solid momentum. 🚀
Overall sentiment remains bullish — watching closely for volume confirmation and breakout candle before the next move. 💼
Trade ideas

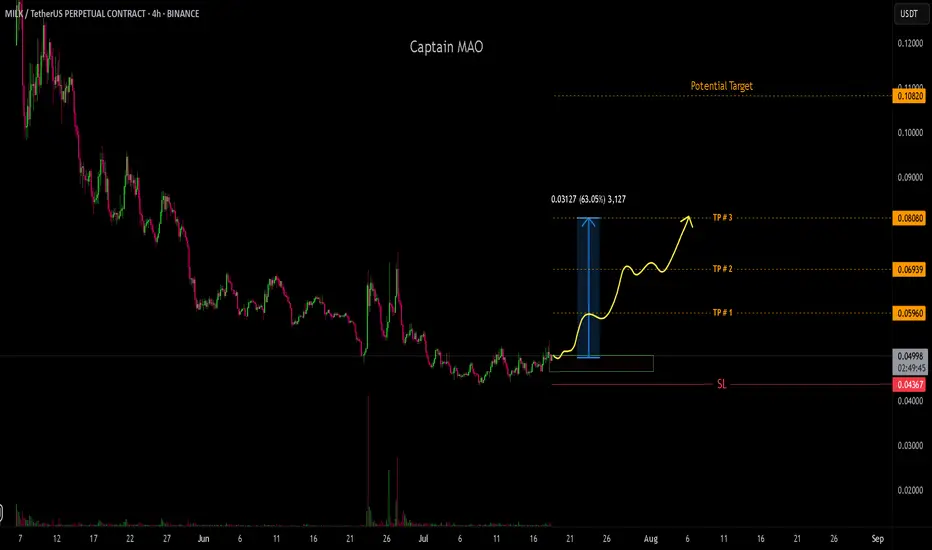
$MILK LONG TRADE IDEAI hope everyone understands risk management well. I am taking a long trade in milk, and you can follow along too. The targets are mentioned in the chart.
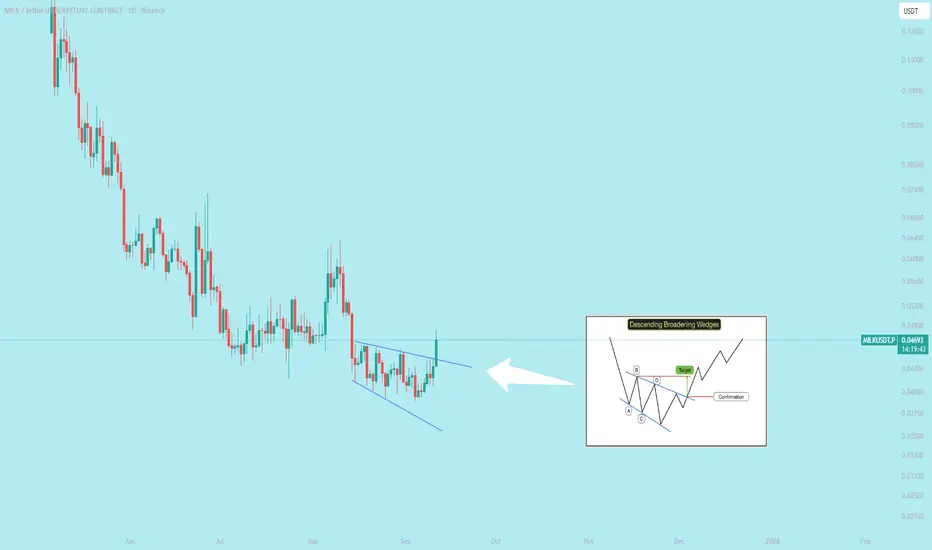
$MILK Breakout Descending Broadening Wedge Patterna bullish reversal pattern in technical analysis that forms during a downtrend. Characterized by increasing volatility, it is outlined by two downward-sloping, diverging trendlines that form a megaphone shape. The pattern indicates a potential long-term trend reversal where bearish momentum is weakening, and bullish sentiment is gaining.
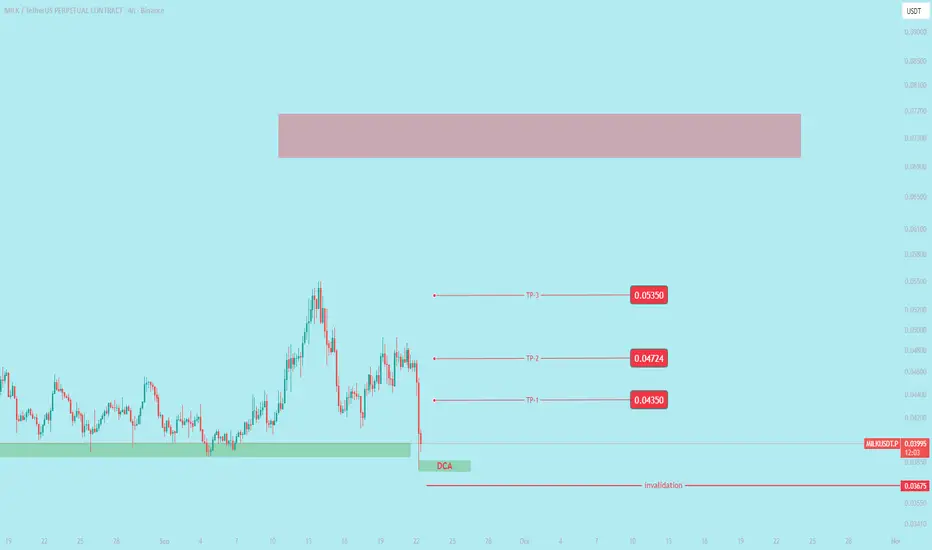
MILK/USDTMILK/USDT looking bullish and gearing up for a potential parabolic move after successfully sweeping liquidity below the key 0.05 zone. Buyers stepped in aggressively after the shakeout, reclaiming the support zone with strong momentum. Current price action suggests accumulation is complete, and the pair may be preparing for a breakout toward higher targets. Ideal entry lies around the green box

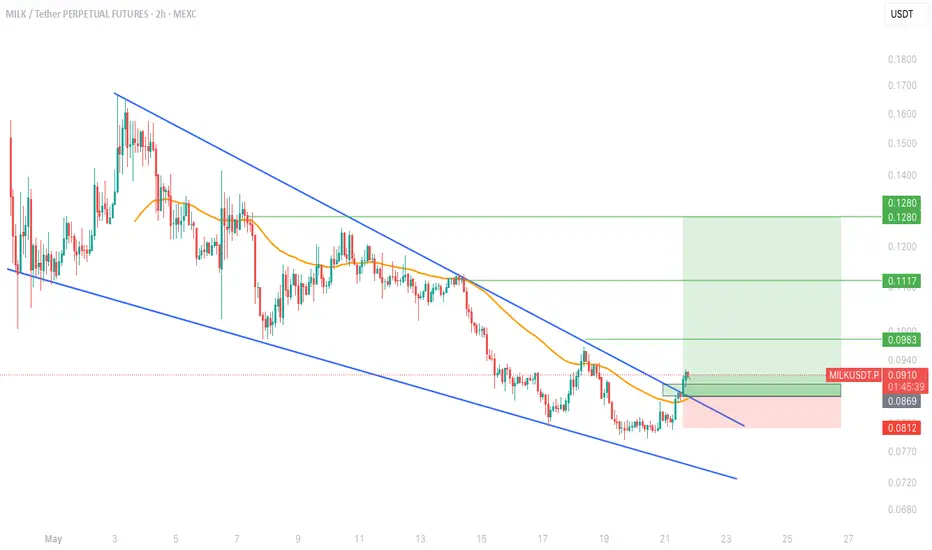
$MILKUSDT long trade set-up!📉 After a prolonged downtrend within a falling wedge pattern, CBOE:MILK finally broke out!
✅ Breakout confirmation just above the wedge resistance
📈 Potential targets:
TP1: $0.0983
TP2: $0.1117
TP3: $0.1280
🛑 Stop-loss: $0.0812 (just below key support zone)
This setup is offering a strong R:R ratio post-breakout.
Watch price action closely before entering, and always use SL!
MILK Price Consolidation AnalysisMILK/USDT is showing signs of consolidation after a recent price drop. The current price of $0.1201 is hovering around the 30-day moving average, indicating a potential pivot point. Traders should watch for a break above the 10-day moving average ($0.1229) as a bullish signal.

MILK Support Level AssessmentThe support level at $0.1201 for MILK/USDT is being tested after an 8.25% drop. If this level holds, it could signal a reversal. However, a break below might lead to further declines. MACD indicators are showing a bearish crossover, suggesting caution.

MILK's Short-Term Trend AnalysisShort-term MILK/USDT traders are facing a challenging market with the current downtrend. The immediate resistance at $0.1229 could be a target for a rebound. However, the overall bearish MACD suggests that the path of least resistance is lower.

MILK Price Action Post-DropFollowing an 8.03% drop, MILK/USDT is finding support around $0.1201. A bounce from this level could signal a short-term bottom. Traders should monitor volume for confirmation of a potential reversal.

MILK's Moving Average CrossoversMILK/USDT has experienced a bearish crossover with the 5-day MA crossing below the 10-day MA. This could indicate further downside pressure. Traders should look for a cross back above the 10-day MA for a bullish signal.

MILK's Volume Profile AnalysisThe volume profile for MILK/USDT shows a significant trading cluster around $0.1201. This level could act as a strong support or resistance depending on the market sentiment. Increased volume at this level could lead to a price breakout.

MILK's MACD Divergence InsightThere is a potential bearish divergence forming in the MILK/USDT MACD, with the price making lower lows while the MACD makes higher lows. This could foreshadow a reversal if confirmed by price action.

MILK's Resistance Break PotentialThe resistance level at $0.1229 for MILK/USDT is crucial. A strong close above this level could signal a bullish breakout. Traders should be prepared for increased volatility if this level is challenged.

MILK's Downtrend Channel AnalysisMILK/USDT is currently within a descending channel, with the price testing the lower boundary. A break below this channel could lead to a further decline. Conversely, a move above the upper boundary could indicate a trend reversal.

MILK's RSI Overbought/Oversold LevelsThe Relative Strength Index (RSI) for MILK/USDT is approaching oversold territory, which could suggest a potential bounce. Traders should monitor the RSI for a move back above 30 to confirm a reversal from oversold conditions.

Bearish Engulfing at Key LevelTimeframe: 4H
Analysis: A bearish engulfing candle formed at $0.1226, rejecting the $0.13 resistance. The price at $0.1213 is below the 20 SMA ($0.1220), and the Stochastic %K crossed below %D above 80, signaling a reversal. The $0.115 support is weak, with $0.1020 as the next target if broken.
Trade Setup:
Entry: Short below $0.1180.
Stop Loss: $0.1235.
Target: $0.1100 (TP1), $0.0950 (TP2).
Risk-Reward Ratio: ~1:3.
Note: Monitor for follow-through selling. BTC weakness could amplify the move.

Overextended Pump FadingTimeframe: 1H
Analysis: CBOE:MILK ’s +14.9% pump to $0.1493 looks overextended, with the price at $0.1213 now forming lower highs. The Parabolic SAR flipped bearish, and the price is testing the 0.5 Fibonacci retracement ($0.1200) of the $0.1020–$0.1651 move. A break below $0.1180 could see a retrace to $0.11.
Trade Setup:
Entry: Short below $0.1180.
Stop Loss: $0.1240.
Target: $0.1100 (TP1), $0.1020 (TP2).
Risk-Reward Ratio: ~1:2.5.
Note: CBOE:MILK ’s GETTEX:36M market cap suggests room for volatility. Stay nimble.

Liquidity Grab at $0.12Timeframe: 15M
Analysis: CBOE:MILK ’s spike to $0.1364 appears to be a liquidity grab, trapping late buyers. The price at $0.1213 is now below the 50 EMA ($0.1220), and the Bollinger Bands are contracting, signaling a potential sharp move. A drop below $0.1180 targets the $0.11 demand zone. Recent X posts note fading momentum.
Trade Setup:
Entry: Short below $0.1180.
Stop Loss: $0.1230.
Target: $0.1120 (TP1), $0.1050 (TP2).
Risk-Reward Ratio: ~1:2.
Note: Scalping setup. Exit quickly if $0.1226 is reclaimed.

Descending Triangle BreakdownTimeframe: 4H
Analysis: CBOE:MILK is forming a descending triangle, with lower highs (latest at $0.1364) and support at $0.115. The price at $0.1213 is near the triangle’s apex, and declining volume suggests a breakdown is likely. A close below $0.115 could trigger a sharp move to $0.1020, as seen in prior dips.
Trade Setup:
Entry: Short on break below $0.115.
Stop Loss: $0.1220.
Target: $0.1050 (TP1), $0.0950 (TP2).
Risk-Reward Ratio: ~1:2.5.
Note: High risk due to CBOE:MILK ’s volatility. Confirm with BTC’s trend.

Rejection at 200 EMATimeframe: Daily
Analysis: CBOE:MILK is struggling to break the 200 EMA ($0.1250), forming multiple wick rejections at $0.1226–$0.1240. The ADX is below 25, indicating a lack of trend strength, and the price is below the Ichimoku Cloud, signaling bearish bias. A drop below $0.115 could target the $0.10 psychological level.
Trade Setup:
Entry: Short below $0.115.
Stop Loss: $0.1260 (above 200 EMA).
Target: $0.1050 (TP1), $0.0950 (TP2).
Risk-Reward Ratio: ~1:3.
Note: CBOE:MILK ’s TVL ($190M) suggests liquidity, but price action remains weak. DYOR.

Bearish Divergence on RSITimeframe: 1H
Analysis: CBOE:MILK ’s recent push to $0.1364 showed bearish RSI divergence, with higher price highs but lower RSI peaks. The current price of $0.1213 is testing the 30 MA ($0.1162), which may act as weak support. A failure to hold $0.1162 could see a quick drop to $0.11, aligning with the 0.786 Fibonacci retracement.
Trade Setup:
Entry: Short below $0.1162.
Stop Loss: $0.1226.
Target: $0.1100 (TP1), $0.1020 (TP2).
Risk-Reward Ratio: ~1:2.
Note: CBOE:MILK ’s volatility demands caution. Monitor for increased selling volume.

Head and Shoulders FormingTimeframe: 4H
Analysis: CBOE:MILK is tracing a potential head and shoulders pattern, with the head at $0.1651 and the right shoulder forming near $0.1226. The neckline at $0.115 is under pressure, and the MACD is showing a bearish crossover. A break below $0.115 could accelerate selling toward $0.10. Recent X posts highlight overbought Stochastic signals.
Trade Setup:
Entry: Short on break below $0.115.
Stop Loss: $0.1240 (above right shoulder).
Target: $0.1050 (TP1), $0.0950 (TP2).
Risk-Reward Ratio: ~1:3.
Note: Confirm the break with volume. Avoid if BTC shows sudden strength.
