MNT Pullback to Key Support – Bounce Incoming?MNT has seen a significant drop over the past few days, but it's now entering a major support zone where price previously found strong demand. This could present a high-reward opportunity for traders watching for a potential reversal or bounce from this level.
📌 Entry Zone: $1.053 – $1.060
🎯 Take Profits: $1.35, $1.54
⛔ Stop Loss: $1.03
The entry area aligns with a strong demand zone, and if price reacts positively here, there's room for a technical bounce toward the next resistance levels. Look for confirmation via price action – bullish candles, volume spikes, or divergence setups could all strengthen the case.
🧠 Trade Smart: Always use proper risk management. This is not financial advice, just an idea based on chart structure and support/resistance zones. Trade at your own discretion.
Market insights

MNT is in a range. Clean level-based marketMNT is currently not trending. The market has entered a clear sideways range. After the upward impulse, price moved into consolidation, trading between well-defined supply and demand zones.
Key structure points:
Blue zone is the buyer’s interest area. Price already reacted from this zone before, making it a logical support area.
Red zones above are sell and distribution areas. This is where price previously stalled and reversed lower.
While price stays inside this range:
momentum is weak
moves are corrective, not impulsive
direction is not confirmed
This is not a market for aggressive longs or shorts.
This is a market for level-based execution.
In such conditions, grid logic works best:
buying closer to lower blue zones
taking profit or selling into upper red zones
no rush
no expectation of a breakout move
Smart money does not try to predict the future in a range.
It reads context and extracts repeated reactions.
As long as the range holds, I trade from the zones.
When structure breaks, it will be obvious.

MNTUSDT LONG swing RR 1:4
Confidence : 7/10
entry : market
tp : as planned or after stoch D oversold / crossdown
confluence :
1. stoch cross oversold
2. stoch divv D
3. mantul 0.5 fib
4. hovering VAH
5. try to reclaim 1321ema
6. trendline BO possible reversal

Long Idea ON $MNTWe are currently in a downtrend from $2.87. This rise is therefore a correction within the overall falling trend. According to wave analysis, the potential target is $1.80, which gives a risk/reward ratio of approximately 1:2.5 or higher (depending on where you set your stop-loss). The setup remains valid until the high around $2.87 is updated.
Remember to manage your risks.

MNTUSDT // cup-handle formationAlthough there is a cup handle formation on the chart, let's look for closings above the yellow line. The first target of the formation can be followed as 1.2021, which corresponds to Fibo 1.414 of the exit, and 1.3057 in case we see closings above the level I mentioned.

TradeCityPro | MNT Testing Key Levels for Bullish Breakout👋 Welcome to TradeCityPro!
In this analysis, I want to review MNT, a Layer-2 Ethereum project with a $3.4 billion market cap, currently ranked 31st on CoinMarketCap.
⏳ 4-Hour Timeframe
On the 4-hour timeframe, this coin has been in a downtrend, and after reaching 0.9596, it entered a range phase.
✔️ Currently, a range box has formed between 0.9596 and 1.1207, and the price is reacting to the top of the box at 1.1207.
💥 On the RSI, we have a very important resistance level at 65.80.
🔔 A break of this level on the RSI would confirm the entry of bullish momentum, and in this case, we can open a long position after the 1.1207 level is broken.
✨ Breaking 1.1207 will be the first confirmation of the bullish trend for MNT, and the coin could initiate an upward wave.
🧩 This upward movement could continue toward 1.3478.
⚖️ However, if the price gets rejected at 1.1207 and moves back toward 0.9596, we can open a short position after breaking the 0.9596 support level.
📝 Final Thoughts
Stay calm, trade wisely, and let's capture the market's best opportunities!
This analysis reflects our opinions and is not financial advice.
Share your thoughts in the comments, and don’t forget to share this analysis with your friends! ❤️

TradeCityPro | MNTUSDT The Moment of Decision👋 Welcome to TradeCityPro!
Let’s take a look at MNT, the main token of the Mantle chain—one of the notable projects in the DeFi ecosystem.
🌐 Bitcoin Overview
Before we begin, let me remind you once again that at your request, we’ve moved the Bitcoin analysis section to a dedicated daily report — allowing us to analyze Bitcoin’s trend, dominance, and overall market sentiment in greater depth each day.
On the daily timeframe, $2.68 acted as the major resistance, from which the price was rejected. Since then, the market has been ranging for a long period while consistently forming lower highs above the $1.58 support zone.
Currently, after bouncing from $0.9415, price has moved upward toward $1.0962, but only with small candles and very low volume, indicating weak momentum.
After getting rejected from this zone and experiencing an increase in volume, the chart is now heading back toward $0.9415.
If this level breaks, we could see a sharp decline, making short positions the more logical setup.
For a long position, we need to see a solid reaction and upward movement from this support, followed by the formation of a new bullish structure before considering any entries.
📝 Final Thoughts
Stay calm, trade wisely, and let's capture the market's best opportunities!
This analysis reflects our opinions and is not financial advice.
Share your thoughts in the comments, and don’t forget to share this analysis with your friends! ❤️

MNT is showing an interesting MNT is showing an interesting setup from a technical perspective. Price bounced off the demand zone 0.94- 1.02, where liquidity was absorbed and the market began forming a potential reversal base.
The key level right now is 1.02–1.08. If this range holds and we do not see a breakdown — the structure may shift into a steady uptrend with targets above current price.
My scenario looks like this
Initial rise and small pullback
Break above 1.12–1.15
Next liquidity target sits at 1.22–1.27
Main reaction area is 1.30–1.36 where I expect heavier profit-taking
Everything is simple. Losing 1.02 invalidates the setup. Holding above it keeps the bullish scenario alive.
In summary, MNT is at a point where the trend can revive. Market gave the first positive signal, but confirmation is needed. I observe calmly. No hype. If signal comes, I am ready to execute the long side.

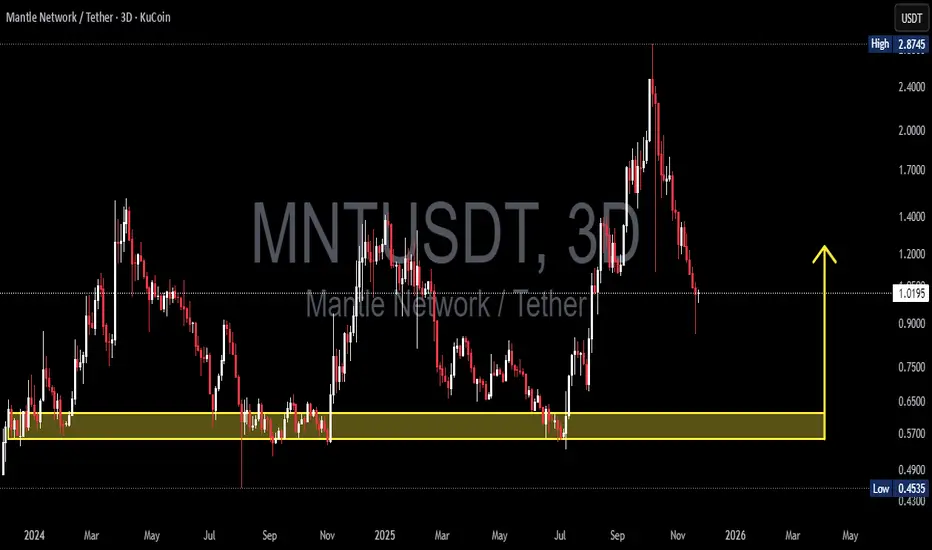
MNT/USDT — Decision Zone! Strong Rebound or Deeper Breakdown?MNT/USDT (3D) is entering the most critical phase since its parabolic rally to 2.87. After an aggressive vertical run driven by pure momentum and euphoria, the market is now in a decisive phase — where the next major trend will be defined.
The sharp drop from the peak indicates heavy distribution and a clear shift in control from buyers to sellers. But the bigger story isn’t finished yet—because price is now approaching the key historical demand zone at 0.62–0.555, an area that has acted as the main defensive wall for bulls and the birthplace of multiple strong reversals over the past year.
This is where “smart money” usually plays.
This is the battlefield that will determine whether MNT revives its mid-term bullish trend or enters a full macro downtrend.
---
🔥 Key Technical Patterns & Structure
1. A Complete Blow-Off Top
The vertical rally to 2.87 followed by a large reversal candle signals exhaustion and strong distribution.
2. Structured Correction Toward Demand
Price is sliding downward in a controlled wave structure toward the highlighted 0.62–0.555 zone.
3. Demand Zone = The Make-or-Break Area
This zone has repeatedly acted as:
strong rebound origin (Jul–Sep 2024)
major accumulation base (Q1–Q2 2025)
launchpad for the rally to local highs
If this zone holds again, bulls regain the upper hand.
If it breaks, momentum shifts decisively to bears.
---
🟢 BULLISH SCENARIO — The Path to a Strong Rebound
A bullish reversal becomes valid only if:
1. Price taps the 0.62–0.555 zone and prints a strong 3D reversal candle
(hammer, bullish engulfing, long rejection wick).
2. Market forms a Higher Low on the 3D timeframe
This signals the end of the downturn and the birth of a new bullish leg.
3. Break & 3D Close above the 1.20–1.40 region
This resistance cluster is the gateway to a full recovery.
➡️ Bullish Targets:
1.20 → 1.40 → 1.70 → 2.20 → 2.80 (local peak)
➡️ Smart-Money Accumulation Zone:
0.62 – 0.555
---
🔴 BEARISH SCENARIO — If the Demand Zone Breaks
The bearish narrative activates if:
1. Price closes below 0.555 on the 3D chart
This is a strong structural breakdown.
2. 0.62–0.555 flips into resistance after a failed retest
This is the most reliable confirmation of bearish continuation.
3. Price moves toward the liquidity pool at 0.45
A historically untouched low-level liquidity zone.
➡️ Bearish Targets:
0.555 break → 0.45 → potential deeper capitulation
---
🎯 Final Conclusion
The 0.62–0.555 demand zone is the most important level of the year for MNT.
If it holds → a major bullish recovery is possible.
If it breaks → the market shifts into a deeper correction phase.
This is the moment where the next big directional move will be decided.
#MNTUSDT #Mantle #CryptoAnalysis #KeyLevels #DemandZone #PriceAction
#MarketStructure #BullishScenario #BearishScenario #SmartMoney #ReversalZone
Mnt will touch next resistance 32% gain toward 2.16$Hi
the support and resistances on the chart are based on the previous data and weekly candlesticks if TSX:MNT USDT holds this last support the potential of 32% gain is logical toward 2.16$

#MNT/USDT Mantle Momentum: Still Full Throttle#MNT
The price is moving within an ascending channel on the 1-hour timeframe and is adhering to it well. It is poised to break out strongly and retest the channel.
We have a downtrend line on the RSI indicator that is about to break and retest, which supports the upward move.
There is a key support zone in green at the price of 1.39, representing a strong support point.
We have a trend to stabilize above the 100-period moving average.
Entry price: 1.43
First target: 1.47
Second target: 1.51
Third target: 1.58
Don't forget a simple money management rule:
Place your stop-loss order below the support zone in green.
Once the first target is reached, save some money and then change your stop-loss order to an entry order.
For any questions, please leave a comment.
Thank you.

MNT/USDT —Retest: Will Mantle Hold the Line or Break Down?MNT has just completed a major breakout cycle from a long accumulation range below 1.40 USDT, marking the beginning of a strong expansion phase that pushed the price up to a peak of 2.87 USDT.
After this sharp rally, however, the chart shows a strong rejection, pulling the price back toward the historical breakout zone at 1.25–1.40, which now acts as the primary support base.
This area is more than just a technical level — it’s a decision zone that will determine whether MNT is ready to continue its mid-term bullish trend or confirm a distribution and potential trend reversal.
---
Structure & Price Pattern
The chart currently displays a breakout → retest → decision point structure, where price is testing a former supply area that has flipped into demand.
The latest 3D candle shows indecision after a strong selloff, signaling a tug-of-war between buyers defending structure and sellers pushing for breakdown.
As long as price holds above 1.25, the higher-low formation remains intact, keeping the mid-term uptrend technically valid.
---
Key Technical Zones
Main Support: 1.25–1.40 (key structural zone).
Minor Resistance: 1.73 (pivot retest zone).
Major Resistances: 2.48 and 2.87 (liquidity zones).
Next Supports if breakdown occurs: 1.00 → 0.85 → 0.45.
---
Bullish Scenario
If MNT manages to close a solid 3D candle above 1.40, this move would confirm a successful retest of the major breakout.
Such confirmation could trigger Expansion Wave 2, with potential upside targets at 1.73 → 2.48 → 2.87.
This scenario highlights the strength of buyers maintaining control over demand and extending the mid-term continuation trend.
---
Bearish Scenario
If selling pressure continues and the price closes below 1.25, the prior breakout risks becoming a false breakout or bull trap.
This scenario could trigger a liquidity sweep toward 1.00 – 0.85, and in more aggressive conditions, an extended retracement down to 0.45.
Such movement would signal the end of the expansion phase and the start of a redistribution phase.
---
Market Narrative & Conclusion
MNT is now sitting in the most critical zone of its technical cycle.
The 1.25–1.40 range will decide the next chapter:
Holding above = foundation for a new expansion phase.
Breaking below = confirmation of distribution and corrective structure.
Technically, this is the “make-or-break retest” — a moment that often precedes the next major move in the altcoin market.
---
#MNT #Mantle #Crypto #Breakout #Retest #AltcoinAnalysis #TechnicalAnalysis #KeySupport

MNTTSX:MNT has finally reached my buy zone, I’m taking the risk here and positioning for upside. Targeting $4 as the next major level, with strong potential once momentum returns. Good R:R setup forming for early entries.

MNTKeep an eye on the W pattern forming on TSX:MNT , it’s a textbook setup. Many altcoins will mirror this structure soon. Wait for the retest back to the support zone before entering, then set a tight stop loss to manage risk and ride the next leg up cleanly.

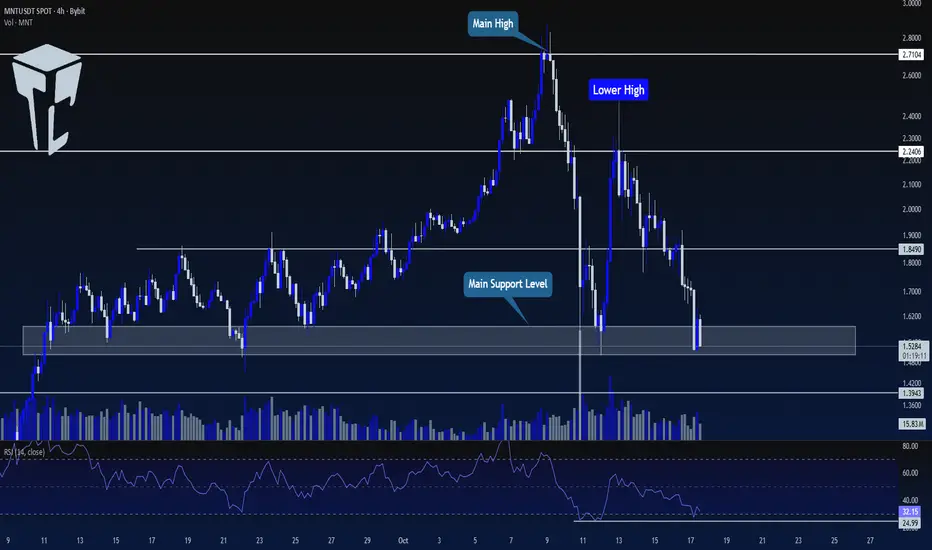
TradeCityPro | MNT: Key Support Holds for Now👋 Welcome to TradeCity Pro!
In this analysis, I want to review the MNT coin for you. One of the most well-known Ethereum Layer 2 projects, with a market cap of $5.03 billion, ranked 26th on CoinMarketCap.
⏳ 4-Hour Timeframe
On the 4-hour chart, after an upward trend, this coin reached 2.7104 and has now entered a corrective and bearish phase.
✨ There is a very important support zone around 1.5. The price has reacted to it once, formed a lower high, and is now back on support.
💥 The RSI oscillator is near the Oversell area. Breaking 24.99 will push the RSI into Oversell.
✔️ For short positions, we can enter on a break of this range. However, since the higher timeframe trend is bullish, we should also consider confirmation from volume, RSI, and Bitcoin.
🔍 For long positions, we need to wait until the market structure creates a proper trigger for a long. Currently, the main confirmation for bullishness is a break of 2.2406.
📝 Final Thoughts
Stay calm, trade wisely, and let's capture the market's best opportunities!
This analysis reflects our opinions and is not financial advice.
Share your thoughts in the comments, and don’t forget to share this analysis with your friends! ❤️
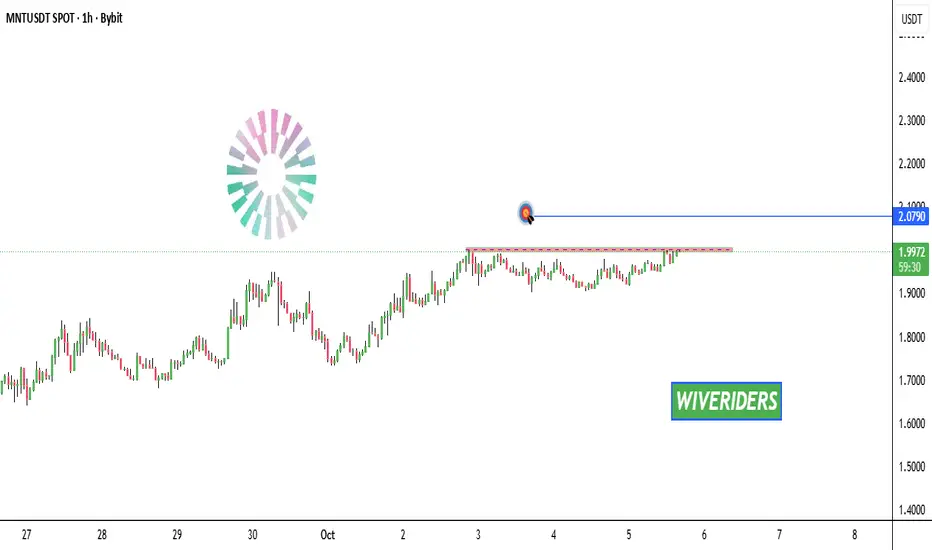
MNTUSDT – Key Decision Zone AheadAfter a sharp recovery from the $1.39 support area, TSX:MNT is consolidating inside a symmetrical triangle just above the 21-hour SMMA and 144-EMA.
This zone is shaping up as a classic continuation or reversal setup – the market is gathering energy for the next leg.
Scenarios
🟢 Bullish breakout:
If price breaks and holds above $2.06–$2.10, it opens the road toward the next resistance levels:
$2.26 (local supply zone / previous structure high)
$2.48
Extended target: $2.78
🔴 Bearish rejection:
Failure to hold the current ascending channel may trigger a move down toward:
$1.51
$1.39 (major liquidity area and 50% retracement zone)
Technical outlook
Structure: Symmetrical triangle within a broader uptrend channel
Momentum: Neutral – consolidation after impulse
Trade idea: Wait for breakout confirmation and retest.
Entry (breakout long): > $2.10
Stop-loss: below $1.95
TP1: $2.26, TP2: $2.48, TP3: $2.78
⚠️ Not financial advice. For educational and analytical purposes only.


MNTTSX:MNT shows a clear double bottom on the weekly and monthly charts. This kind of structure will become the new norm across altcoins. Price already exceeded the W pattern target, delivering a 423% move from bottom to top. Trading is all about patience and timing.

Mantle Momentum: Still Full ThrottleMantle’s uptrend remains strong — the key question now is whether this wave cools off for a reset or goes full parabolic from here. Strong fundamentals and real utility continue to drive the rally.
Mantle is breaking new ground in RWA tokenization through strategic partnerships. The recent Bitfinex listing clearly ignited momentum, pushing MNT hard across markets.
MNT ripped to $2.87, extending its multi-day rally with strong volume. Price is now consolidating around $2.70–$2.75, hinting at a healthy breather before the next potential leg up — provided bulls defend the current zone.
Support: $2.50 - $2.45
Resistance : $2.85 - $3.00
Holding above $2.50 keeps the structure firmly bullish. A clean breakout over $2.85 could open the way toward the $3-$3.20. On the flip side, losing 2.50 support or if Bitcoin loses 120k level may trigger a short-term pullback to $2-$1.80 before continuation.

Mantle eyes 20% breakout, targeting strong 2.20 Hello✌️
Let’s analyze Mantle’s price action both technically and fundamentally 📈.
🔍Fundamental analysis:
Mantle (MNT) is adding more use cases on specific exchange, from collateral to fee discounts and staking. Bigger spot pairs and options trading could boost demand, but relying on one exchange also brings risk.
📊Technical analysis:
BYBIT:MNTUSDT continues to trade within a strong ascending channel, showing resilience compared to many peers, and is now testing a key daily support near the channel’s lower boundary 📊; if this level holds, a potential upside move of around 20% toward the 2.20 area could be anticipated 🚀.
📈Using My Analysis to Open Your Position:
You can use my fundamental and technical insights along with the chart. The red and green arrows on the left help you set entry, take-profit, and stop-loss levels, serving as clear signals for your trades.⚡️ Also, please review the TradingView disclaimer carefully.🛡
✨We put love into every post!
Your support inspires us 💛 Drop a comment we’d love to hear from you! Thanks, Mad Whale

Mantle Tests Upper Zone, 22% Rally Toward 2.70 PossibleHello✌️
Let’s analyze Mantle’s price action both technically and fundamentally 📈.
🔍Fundamental analysis:
Mantle (MNT) is teaming up deeper with specific exchange, more spot pairs, fee discounts, and MNT as collateral. It’s kind of like what happened with BNB on its exchange, showing how MNT’s real use might grow over time.
📊Technical analysis:
BYBIT:MNTUSDT has pushed above its ascending channel and is now testing the upper zone, showing potential strength. If momentum holds, a 22% upside toward 2.70 could materialize. 🚀📈
📈Using My Analysis to Open Your Position:
You can use my fundamental and technical insights along with the chart. The red and green arrows on the left help you set entry, take-profit, and stop-loss levels, serving as clear signals for your trades.⚡️ Also, please review the TradingView disclaimer carefully.🛡
✨We put love into every post!
Your support inspires us 💛 Drop a comment we’d love to hear from you! Thanks, Mad Whale


MNT Update📊 📊 MNT Update
MNT is testing the red resistance zone 🔴
If it breaks out, the first target will be the blue line level 🎯
Wait for confirmation before entering — a breakout could indicate the start of a bullish continuation 🚀