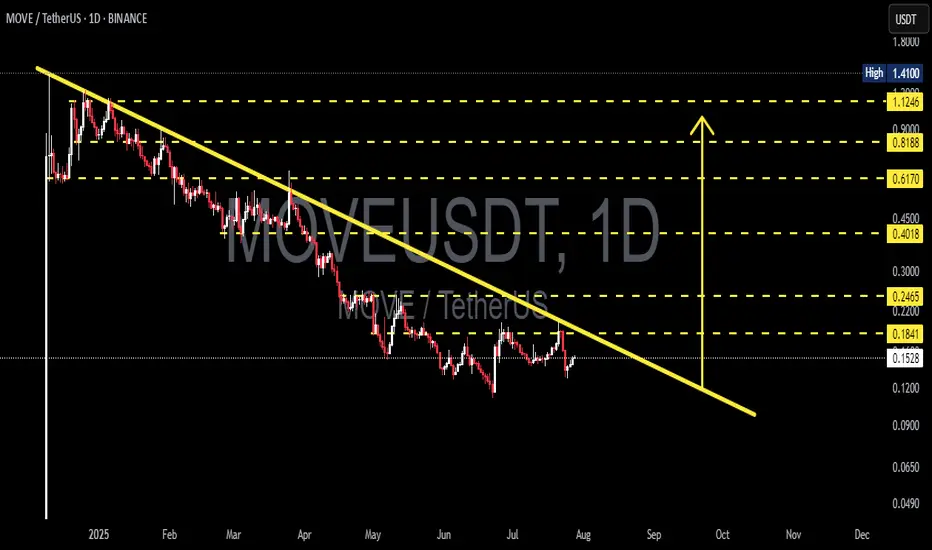
MOVEUSDT — Descending Triangle Critical: Breakout or Breakdown?📊 Chart Analysis
The MOVE/USDT daily chart is currently forming a clear Descending Triangle pattern. This structure is defined by:
A downward sloping resistance trendline (yellow) that has been pressing the price lower since the beginning of the year.
A horizontal support zone (yellow box) around

MOVEUSDT | Long | L2 Narrative Support | (Aug 8, 2025)MOVEUSDT | Long | Oversold Tech + L2 Narrative Support | (Aug 8, 2025)
1️⃣ Quick Insight:
MOVE is trading near ATL levels while Layer-2 and Move VM narratives are gaining traction again. This setup offers a high-reward potential if momentum returns.
2️⃣ Trade Parameters:
Bias: Long
Entry Zone: ~0.

MOVEUSDT Long-Term Downtrend Line – Breakout or Downside Ahead?📊 MOVE/USDT Chart Analysis (1D Timeframe)
On the daily chart, MOVEUSDT has been locked in a strong downtrend since early 2025. The dominant descending trendline (yellow) clearly outlines the continuous selling pressure, with a series of lower highs and lower lows.
Price is currently trading just b
MOVEUSDT 1D#MOVE has been moving inside a descending channel for several months. It has broken above the daily EMA50 and the Ichimoku Cloud and is now on the verge of breaking out above the channel resistance.
However, with the RSI in the overbought zone and relatively low volume, there’s a chance #MOVE may r

MOVE (SPOT)BINANCE:MOVEUSDT
#MOVE/ USDT
Entry range(0.1530 - 0.1560)
SL 4H close below 0.1490
T1 0.17
T2 0.18
T3 0.20
T4 0.22
_______________________________________________________
Golden Advices.
********************
* collect the coin slowly in the entry range.
* Please calculate your losses before th

MOVE : Where to buy ?Hello friends
Given the upcoming token release, the price is expected to continue to fall, so be careful.
In case of a fall, we have identified important support levels for you, where you can buy with capital and risk management.
*Trade safely with us*

$MOVE | Bottom is likely inA solid case that TVC:MOVE is bottoming out.
1. Bullish shift in structure
2. RSI daily triple divs
3. Break of 200 4h EMA
4. Volume supported breakout
5. Reclaim of previous range
6. Liquidity pool at 0.25-0.29 untapped
On chain is also bullish:
7. DeFi apps gain revenue
8. Stable coins are fl

MOVEUSDT.P – Long Setup from 61.8%–78.6% Fibonacci Retracement ZMOVEUSDT.P is currently testing a deep retracement after a strong bullish leg. Price is reacting to the key Fibonacci zone (61.8%–78.6%), which has held as support multiple times.
Waiting for confirmation via MACD momentum shift or bullish engulfing to validate entry. Risk-managed long setup target

MOVE/USDT – Long-Term Breakout WatchTimeframe: 4H (Long-Term Setup)
MOVE is testing a long-term descending trendline. After months of consistently lower highs, we may be on the verge of a bullish breakout.
The previous breakout attempt in April was a fakeout, but the current consolidation near resistance looks healthier and more sust

Move long back to $0.1654Just now opened a long position on move.
Targeting 0.1654. Will be scaling out along the way. Might scale in as well.
Market is still respecting bullish structure so I anticipate another pump soon.

See all ideas
Summarizing what the indicators are suggesting.
Oscillators
Neutral
SellBuy
Strong sellStrong buy
Strong sellSellNeutralBuyStrong buy
Oscillators
Neutral
SellBuy
Strong sellStrong buy
Strong sellSellNeutralBuyStrong buy
Summary
Neutral
SellBuy
Strong sellStrong buy
Strong sellSellNeutralBuyStrong buy
Summary
Neutral
SellBuy
Strong sellStrong buy
Strong sellSellNeutralBuyStrong buy
Summary
Neutral
SellBuy
Strong sellStrong buy
Strong sellSellNeutralBuyStrong buy
Moving Averages
Neutral
SellBuy
Strong sellStrong buy
Strong sellSellNeutralBuyStrong buy
Moving Averages
Neutral
SellBuy
Strong sellStrong buy
Strong sellSellNeutralBuyStrong buy
Displays a symbol's price movements over previous years to identify recurring trends.