9/12/25 Bears Need Follow-through Selling
Monday’s candlestick (Dec. 8) was a bear bar closing near its low.
In our previous report, we stated that traders would see whether the bulls could create a follow-through bull bar closing above the 20-day EMA, or if the market would trade lower instead.
The market traded lower testing the Thursday's low (Dec 4) and the bulls could not create a follow-through bull bar.
The bulls hope the selloff (Nov 26) will form a major higher low.
The bulls hope to get a reversal from a large wedge pattern (Jan 17, May 8, and Nov 26).
They see any pullback simply as a retest of the November 26 low, and want it to be weak (overlapping candlesticks, poor follow-through selling), forming a higher low major trend reversal.
They must produce strong follow-through buying above the 20-day EMA to show they are clearly in control.
The bears want the 20-day EMA to act as a resistance level, followed by a retest of the November low. The move may be underway.
They hope for a strong third leg down to form the wedge pattern, with the first two legs being Nov 13 and Nov 26.
At the least, they want a retest of the November 26 low, even if it only forms a higher low.
• Production: Production indicated +5 to 10% in Pen Malaysia for first 5 days.
• Refineries: Buying interest is there at these low prices. Not paying premiums vs spot futures.
• Exports: ITS first five days of Dec: down -20.25%
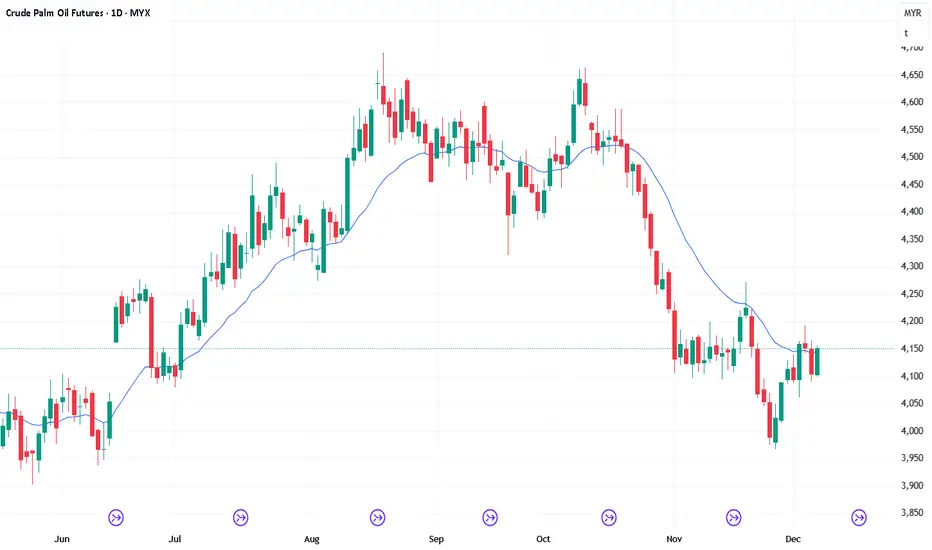
The market sold off in a tight bear channel, followed by a tight trading range in November, which could be a possible final flag, followed by a second leg sideways to down (Nov 26).
The market formed a pullback towards the 20-day EMA and back to the November tight trading range area around 4100-50 area recently.
If the market trades lower, traders will see the strength of the retest of the November 26 low. Will it be strong, breaking below the Nov 26 low? Or will it be weak, perhaps stalling around the December 2 low area? The move is currently underway.
Today (Tuesday, Dec. 9), traders will watch to see whether the bears can create a follow-through bear bar breaking below the tight trading range (4100) level.
Or will the market trade lower, but close with a long tail below, stalling around the December 2 low area?
Andrew
Crude Palm Oil Futures
No trades
Trade ideas

FCPO: Looking to sell.Looking to sell as price is retracing higher in a bearish trend. Area to sell is around 4135-4140. Immediate target is 4000.
Boost the idea if you think the same.
Happy trading.

8/12/25 Market Back to 4100-50 Tight Trading Range Area
Friday’s candlestick (Dec. 4) was an inside bull bar closing near its high.
In our previous report, we stated that traders would watch to see whether the bears could create follow-through selling and close far below the 20-day EMA, or if the market would trade higher to retest the area near the 20-day EMA instead.
The market traded higher to test near the 20-day EMA area. The weekly candlestick closed as a bull bar in its upper half.
The bulls hope the selloff (Nov 26) will form a major higher low.
The bulls hope to get a reversal from a large wedge pattern (Jan 17, May 8, and Nov 26).
They see any pullback simply as a retest of the November 26 low, and want it to be weak (overlapping candlesticks, poor follow-through selling), forming a higher low major trend reversal.
They must produce strong follow-through buying above the 20-day EMA to show they are clearly in control.
The bears want the 20-day EMA to act as a resistance level, followed by a retest of the November low.
If the market trades higher, they want the November 19 high to act as resistance (around 4250-4300 area)
They hope for a strong third leg down to form the wedge pattern, with the first two legs being Nov 13 and Nov 26.
Fundamentals
• Production: Production may be down in December.
• Refineries: Buying interest is there at these low prices. Not paying premiums vs spot futures.
• Exports: ITS first five days of Dec: TBA
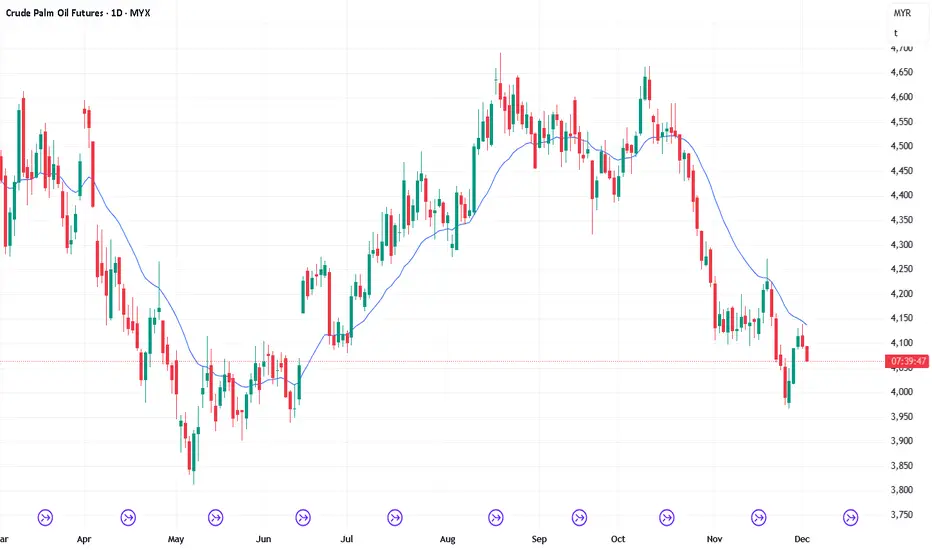
The market sold off in a tight bear channel, followed by a tight trading range in November, which could be a possible final flag, followed by a second leg sideways to down (Nov 26).
The market formed a pullback towards the 20-day EMA and back to the November tight trading range area around 4100-50 area.
If the market trades lower, traders will see the strength of the retest of the November 26 low. Will it be strong, breaking below the Nov 26 low? Or will it be weak, perhaps stalling around the December 2 low area?
Today (Monday, Dec. 8), traders will watch to see whether the bulls can create a follow-through bull bar closing above the 20-day EMA, or will the market trade lower instead?
Will the market be choppy around the 4100-4150 range again like in November?
Andrew
5/12/25 Can Bears Get FT Selling or Retest Above 20-Day EMA?
Thursday’s candlestick (Dec. 4) was a bear bar closing in its lower half with a small tail below.
In our previous report, we stated that traders would watch if the bears could create follow-through selling and close far below the 20-day EMA, or if the market would trade slightly lower but close with a long tail below and above the middle of the candlestick.
The market traded lower and closed below the 20-day EMA.
The bulls hope the selloff (Nov 26) will form a major higher low.
The bulls hope to get a reversal from a large wedge pattern (Jan 17, May 8, and Nov 26).
They see any pullback simply as a retest of the November 26 low, and want it to be weak (overlapping candlesticks, poor follow-through selling), forming a higher low major trend reversal.
They must produce strong follow-through buying above the 20-day EMA to show they are clearly in control.
The bears want the 20-day EMA to act as a resistance level, followed by a retest of the November low.
If the market trades higher, they want the November 19 high to act as resistance (around 4250-4300 area)
They hope for a strong third leg down to form the wedge pattern, with the first two legs being Nov 13 and Nov 26.
Fundamentals
• Production: Production may be down in December.
• Refineries: Buying interest is there at these low prices. Not paying premiums vs spot futures.
• Exports: ITS first five days of Dec: TBA
The market sold off in a tight bear channel, followed by a tight trading range in November, which could be a possible final flag, followed by a second leg sideways to down (Nov 26).
The market formed a pullback towards the 20-day EMA this week.
Next, traders will see the strength of the retest of the November 26 low. Will it be strong, breaking below the Nov 26 low? Or will it be weak, perhaps stalling around the December 2 low area?
Bulls want a strong bull bar today so that the weekly candlestick will close in its upper half, while the bears want a strong bear bar today so that the weekly candlestick will have a bear body and a long tail above.
Today (Friday, Dec. 5), traders will watch to see whether the bears can create follow-through selling and close far below the 20-day EMA, or will the market trade higher to retest the area near the 20-day EMA instead?
Andrew

4/12/25 Can Bears Create Strong Retest of Nov 26 Low?
Wednesday’s candlestick (Dec. 3) was a bear doji closing near its low with a long tail above.
In our previous report, we stated that traders would watch if the bulls could create follow-through buying, or if the market would trade slightly higher but close with a long tail above, closing below the 20-day EMA.
The market traded higher in the morning session but pulled back down to close near the 20-day EMA. FCPO is currently trading below the 20-day EMA following the session last night.
The bulls hope the current decline will form a major higher low.
They hope the recent tight trading range (in Nov) will be the final flag of the move and want the market to reverse back into the tight trading range and the 20-day EMA. The market is here now.
The bulls hope to get a reversal from a large wedge pattern (Jan 17, May 8, and Nov 26).
They see any pullback simply as a retest of the November 26 low, and want it to be weak (overlapping candlesticks, poor follow-through selling), forming a higher low major trend reversal.
They must produce strong follow-through buying above the 20-day EMA to show they are clearly in control.
The bears want the 20-day EMA to act as a resistance level, followed by a retest of the November low.
If the market trades higher, they want the November 19 high to act as resistance (around 4250-4300 area)
They hope to get a third leg down to form the wedge pattern, with the first two legs being Nov 13 and Nov 26.
Fundamentals
• Production: Production may be down in December.
• Refineries: Buying interest is there at these low prices. Not paying premiums vs spot futures.
• Exports: ITS said exports are down -19.68% in November.
The market sold off in a tight bear channel, followed by a tight trading range in November, which could be a possible final flag, followed by a second leg sideways to down (Nov 26).
The market formed a pullback towards the 20-day EMA this week.
Next, traders will see the strength of the retest of the November 26 low. Will it be strong, breaking below the Nov 26 low? Or will it be weak, perhaps stalling around the December 2 low area?
Today (Thursday, Dec. 4), traders will watch if the bears can create follow-through selling and close far below the 20-day EMA, or will the market trade slightly lower, but close with a long tail below and above the middle of the candlestick?
Andrew

10/12/25 Bulls Need FT Buying Closing Above 20-Day EMA
Tuesday’s candlestick (Dec. 9) was a bull bar closing near its high with a long tail below.
In our previous report, we stated that traders would watch to see whether the bears could create a follow-through bear bar breaking below the tight trading range (4100) level, or if the market would trade lower, but close with a long tail below, stalling around the December 2 low area.
The market traded lower, testing the December 2 low area, but reversed to close near its high with a long tail below. The bears were unable to create a follow-through bull bar.
The bulls hope the selloff (Nov 26) will form a major higher low.
The bulls hope to get a reversal from a large wedge pattern (Jan 17, May 8, and Nov 26).
They see any pullback simply as a retest of the November 26 low, and want it to be weak (overlapping candlesticks, poor follow-through selling), forming a higher low major trend reversal.
They want a reversal from a small double bottom bull flag (Dec 2 and Dec 9).
They must produce strong follow-through buying above the 20-day EMA to show they are clearly in control.
The bears want the 20-day EMA to act as a resistance level, followed by a retest of the November low. The move formed in the last few trading days.
They hope for a strong third leg to form the wedge pattern, with the first two legs being on November 13 and November 26.
At the least, they want a retest of the November 26 low, even if it only forms a higher low. So far, it is a higher low (Dec 9).
Fundamentals:
• Production: Production indicated +5 to 10% in Pen Malaysia for the first 5 days.
• Refineries: Buying interest is there at these low prices. Not paying premiums vs spot futures.
• Exports: ITS first five days of Dec: down -20.25%
The market formed a pullback towards the 20-day EMA and back to the November tight trading range area around 4100-50 recently.
If the market trades lower, traders will see the strength of the retest of the November 26 low. Will it be strong, breaking below the Nov 26 low? Or will it be weak, perhaps stalling around the December 2 low area? So far, the retest of the low has stalled at the December 2 low area.
Today (Wednesday, Dec. 10), traders will watch to see whether the bulls can create a follow-through test near or above the 20-day EMA.
Or will the market trade slightly higher, but close with a long tail above?
The 4100-4150 were the prior tight trading range levels in November and could be choppy.
Andrew

3/12/25 Can Bulls Create FT Buying Above the 20-Day EMA?
Tuesday’s candlestick (Dec. 2) was an outside bull bar closing near its high with a long tail below.
In our previous report, we stated that traders would see whether the bulls could create a retest and close above the 20-day EMA, or if the bears create a strong retest of the November low instead.
The market traded slightly lower in the night session but reversed higher, testing the 20-day EMA and closing above it.
The bulls hope the current decline will form a major higher low.
They hope the recent tight trading range (in Nov) will be the final flag of the move and want the market to reverse back into the tight trading range and the 20-day EMA. The market is here now.
The bulls hope to get a reversal from a large wedge pattern (Jan 17, May 8, and Nov 26).
They must produce strong follow-through buying above the 20-day EMA to show they are clearly in control.
The bears want the 20-day EMA to act as a resistance level, followed by a retest of the November low.
If the market trades higher, they want the November 19 high to act as resistance (around 4250-4300 area)
They hope to get a third leg down to form the wedge pattern, with the first two legs being Nov 13 and Nov 26.
Fundamentals
• Production: Production may be down in December.
• Refineries: Buying interest is there at these low prices. Not paying premiums vs spot futures.
• Exports: ITS said exports are down -19.68% in November.
The market sold off in a tight bear channel, followed by a tight trading range in November, which could be a possible final flag, followed by a second leg sideways to down (Nov 26).
The selloff was also climactic and slightly oversold. There could be a minor pullback towards the 20-day EMA. This move is underway.
Today (Wednesday, Dec. 3), traders will see if the bulls can create follow-through buying above the 20-day EMA, or will the market trade slightly higher, but close with a long tail above and closing below the 20-day EMA instead?
Andrew

28/11/25 Bulls Want Strong Weekly Bar, Bears Want Tail Above
Thursday’s candlestick (Nov 27) was a follow-through bull bar closing near its high.
In our previous report, we stated that traders would watch to see if the bulls could create a consecutive bull bar closing near its high, or if the market would trade slightly higher, but the candlestick would close below the middle of its range with a long tail above.
The market traded higher towards the 20-day EMA.
The bulls hope the current decline will form a major higher low.
They hope the recent tight trading range will be the final flag of the move and want the market to reverse back into the tight trading range.
At the least, they hope for a small pullback to the 20-day EMA. This move is underway.
They must produce strong consecutive bull bars to show they are clearly in control.
The bears reached the measured-move target of the 4000–3950 area this week.
The bears want the 20-day EMA to act as a resistance level, followed by a retest of the November low.
They want any pullback (bounce) to be weak, characterized by overlapping candlesticks and a long tail extending above.
Fundamentals
• Production: SPPOMA increased by about 5% in the first 25 days.
• Refineries: Buying interest is still there at these low prices. Not paying premiums vs spot futures.
• Exports: ITS said exports are down 18.48% in the first 25 days.
Overall, the market sold off in a tight bear channel, indicating strong selling momentum.
The market remains Always-In-Short.
The selloff was also climactic and slightly oversold. There could be a minor pullback towards the 20-day EMA, which may have begun.
Today (Friday, Nov. 28), bulls want the candlestick to close near its high, so the weekly candlestick will close as a strong bull bar. If this is the case, the market may trade at least a little higher next week.
Bears want today to close as a strong bear bar, so the weekly candlestick will close with a bear body or a prominent tail above.
Andrew

FCPO - A high probably setupSince the last posting on November 25 2025, the market posed another interesting set up which infer a probable wave 3 developing to the upside if the reading is right.
The price movement displayed retracements and wave relationships are just to befitting to ignore. If this plays out to the guidelines in the principle of the wave theory, then we should expect some form of impulsive upside movement with a caveat below 3968.

FCPO Fibo 2.618now price at RM4,157.
Now price at resistant maybe price can break or pullback to level fibo 1.168 at TF H2.
if price break resistant maybe the price find another resistant.

2/12/25 Can Bulls Create A Strong PB, or Retest Nov Low?
Monday’s candlestick (Dec 1) was a bear bar closing near its low with a long tail above.
In our previous report, we stated that bulls wanted the candlestick to close near its high, so the weekly candlestick would close as a strong bull bar. This was the case.
The market traded slightly higher but reversed lower towards the evening.
The bulls hope the current decline will form a major higher low.
They hope the recent tight trading range will be the final flag of the move and want the market to reverse back into the tight trading range.
At the least, they hope for a small pullback to the 20-day EMA. This move is underway.
The market reached the tight trading range yesterday (Dec 1) and near the 20-EMA, followed by a small pullback lower.
The bulls hope to get a reversal from a large wedge pattern (Jan 17, May 8, and Nov 26).
They hope the current pullback will be minor, followed by a reversal above the 20-day EMA.
They must produce strong consecutive bull bars to show they are clearly in control.
The bears want the 20-day EMA to act as a resistance level, followed by a retest of the November low.
They hope to get a third leg sideways to down to form the wedge pattern with the first two legs being Nov 13 and Nov 26.
Fundamentals
• Production: SPPOMA down 2% in November. Production may be down in December.
• Refineries: Buying interest is still there at these low prices. Not paying premiums vs spot futures.
• Exports: ITS said exports are down -19.68% in November.
The market sold off in a tight bear channel, followed by a tight trading range in October, which could be a possible final flag, followed by a second leg sideways to down.
The selloff was also climactic and slightly oversold. There could be a minor pullback towards the 20-day EMA. The market tested near the 20-day EMA yesterday.
Today (Tuesday, Dec. 2), traders will see if the bulls can create a retest and close above the 20-day EMA, or will the bears create a strong retest of the November low instead.
Andrew
27/11/25 Can Bulls Create a Strong Pullback?
Wednesday’s candlestick (Nov 26) was a bull bar closing in its upper half with a prominent tail above.
In our previous report, we stated that traders would watch to see if the bears could create more follow-through selling and extend the second leg sideways to down, or if the market would stall around the 4000 area and form candlesticks with long tails below in the days ahead, which could indicate some profit-taking activity.
The market traded slightly lower but closed higher for the day and is holding around the 4000 area for now.
The bulls hope the current decline will form a major higher low.
They hope the recent tight trading range will be the final flag of the move and want the market to reverse back into the tight trading range.
At the least, they hope for a small pullback to the 20-day EMA.
They must produce strong consecutive bull bars to show they are clearly in control.
The bears reached the measured-move target of the 4000–3950 area this week.
The next target for the bears is the May low, around the 3800-50 area.
The selloff formed a tight bear channel, indicating strong bearish sentiment and persistent selling pressure.
If there is a pullback, the bears want the 20-day EMA to act as a resistance level.
They want any pullback (bounce) to be weak, characterized by overlapping candlesticks and a long tail extending above.
Fundamentals
• Production: SPPOMA increased by about 5% in the first 25 days.
• Refineries: Buying interest is still there at these low prices. Not paying premiums vs spot futures.
• Exports: ITS said exports are down 18.48% in the first 25 days.
Overall, the market sold off in a tight bear channel, indicating strong selling momentum.
The market remains Always-In-Short.
The selloff was also climactic and slightly oversold. There could be a minor pullback towards the 20-day EMA, which may have begun yesterday.
Today (Thursday, Nov. 27), traders will watch to see if the bulls can create a consecutive bull bar closing near its high.
Or will the market trade slightly higher, but the candlestick close below the middle of its range with a long tail above?
Andrew

Declining Palm Oil Prices : CSE - WATA/AGAL/NAMU/etcFundamentals
Malaysian palm oil futures have entered a corrective phase, plunging to a four-week low with an 8% decline over the period. This price softening is primarily attributed to:
• Demand contraction in key export markets
• Appreciation of the Malaysian ringgit, reducing competitiveness
CSE Companies with exposure to palm oil benefited from favorable pricing over the previous three months, with notable rallies.
Strategy
The recent price correction is unlikely to impact current quarter earnings.
However, next quarter margins may compress if the downtrend persists
Given the current trajectory of international prices, think a prudent profit-booking approach is more appropriate.
Re-entry opportunities may arise post-stabilization, levels to watch are marked in the chart.

26/11/25 Bears Want FT Selling, Bulls Want Pullback
Tuesday’s candlestick (Nov 25) was another follow-through small bear bar closing near its low with a small tail below.
In our previous report, we stated that traders would watch to see if the bears could create more follow-through selling and extend the second leg sideways to down, or if the market would stall around the 4000 area and form candlesticks with long tails below in the days ahead, which could indicate some profit-taking activity.
The market traded lower to reach the measured move target of 4000-3950.
The bulls hope the current decline will form a major higher low.
They hope the recent tight trading range will be the final flag of the move and want the market to reverse back into the tight trading range.
At the least, they hope for a small pullback to the 20-day EMA.
They must produce strong consecutive bull bars to show they are clearly in control. They haven't been able to do so.
The bears’ measured-move target, based on the height of the prior trading range, projects toward the 4000–3950 area. They have achieved this.
The next target for the bears is the May low, around the 3800-50 area.
The selloff formed a tight bear channel, indicating strong bearish sentiment and persistent selling pressure.
If there is a small pullback, odds slightly favor at least a small sideways to down leg to retest the current leg low (now Nov 25).
They need to continue creating follow-through selling to reach the measured move targets.
Fundamentals
• Production: SPPOMA increased by about 10% in the first 20 days.
• Refineries: Buying interest slightly lukewarm. Some refineries are reporting high stock. Not paying premiums vs spot futures.
• Exports: ITS said exports are down 18.48% in the first 25 days.
Overall, the market sold off in a tight bear channel, indicating strong selling momentum.
The market remains Always-In-Short.
Today (Wednesday, Nov. 26), traders will watch to see if the bears can create more follow-through selling and extend the second leg sideways to down.
Or will the market stall around the 4000 area and form candlesticks with long tails below in the days ahead, which can indicate some profit-taking activity?
Andrew

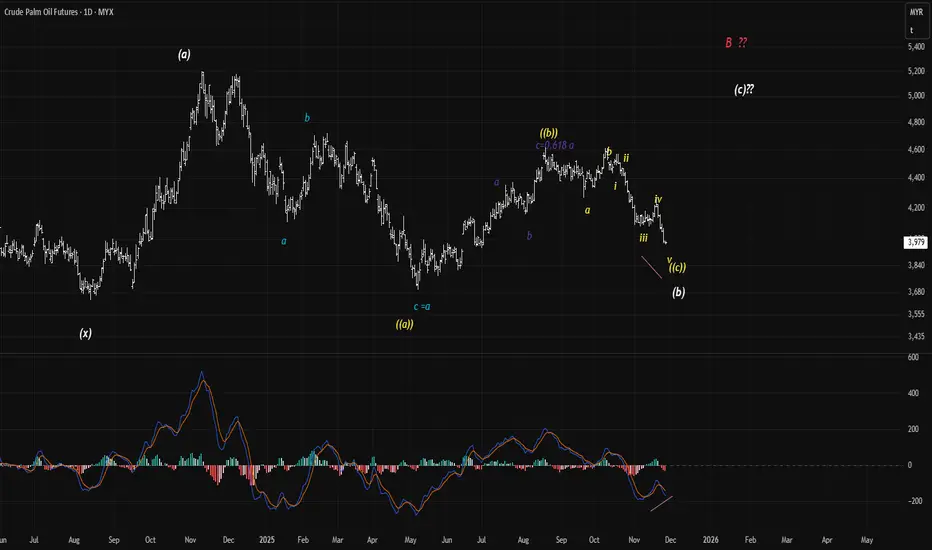
Change in count for FCPOWith the overlap in wave i at 3998, the previous count is negated and thus present an alternate count for wave (b) preceding an expected 5 wave formation of wave (c)to the upside for a major wave B (in red).
Sentiment remains weak but the presence of a divergence between price and MACD is indicative of a potential bottoming and the current pattern of a 5 wave down should stir some interest.
25/11/25 More FT Selling, or Stall?
Monday’s candlestick (Nov 24) was a follow-through small bear bar closing near its low with a prominent tail above.
In our previous report, we said traders would watch if the bears could create more follow-through selling, or if the market would trade slightly lower, but close with a long tail below candlesticks, which could indicate some profit-taking activity.
The market attempted to trade higher in the first half of the day but reversed, closing lower.
The bulls hope the current decline will form a major higher low.
They hope the recent tight trading range will be the final flag of the move and want the market to reverse back into the tight trading range.
They must produce strong consecutive bull bars to show they are clearly in control.
The bears’ measured-move target, based on the height of the prior trading range, projects toward the 4000–3950 area.
The selloff formed a tight bear channel, indicating strong bearish sentiment and persistent selling pressure.
They want a second leg sideways to down. The move is now underway.
They need to continue creating follow-through selling to reach the measured move targets.
Fundamentals
• Production: SPPOMA increased by about 10% in the first 20 days.
• Refineries: Buying interest remains, though not paying premiums vs spot futures.
• Exports: ITS said exports are down 20% in the first 20 days.
Overall, the market sold off in a tight bear channel, indicating strong selling momentum.
The market remains Always-In-Short.
The market formed a pullback to the 20-day EMA, followed by the start of a second leg sideways to down.
Today (Tuesday, Nov 25), traders will watch if the bears can create more follow-through selling and extend the second leg sideways to down.
Or will the market stall around the 4000 area and form candlesticks with long tails below in the days ahead, which can indicate some profit-taking activity?
Andrew

FCPO Masih Bearish ...4080-4100 is support zone. now the support zone is breakout.
today price retest the SBR zone and go down.
maybe price can go up again to retest CBR lebel or RBS.

24/11/25 Possible 2nd Leg Sideways to Down, Bear Need FT
Friday’s candlestick (Nov 21) was a follow-through bear bar closing near its low.
In our previous report, we said traders would watch if the bears could create a strong retest of the November low, trading back into the tight trading range, or if the market would trade slightly lower, but close with long tails below bars.
The market formed a retest and breakout below the Nov 13 low.
The bulls hope the current decline will form a major higher low.
They want the market to reverse back into the tight trading range.
They must produce strong consecutive bull bars to show they are clearly in control.
The bears’ measured-move target, based on the height of the prior trading range, projects toward the 4000–3950 area.
The selloff formed a tight bear channel, indicating strong bearish sentiment and persistent selling pressure.
They see the recent move (Nov 19) as a pullback. They want it to stall around the 20-day EMA, followed by a second leg sideways to down. The move is now underway.
They need to continue creating follow-through selling to reach the measured move targets.
Fundamentals
• Production: SPPOMA increased by about 10% in the first 20 days.
• Refineries: Buying interest remains, though not paying premiums vs spot futures.
• Exports: ITS said exports are down 20% in the first 20 days.
Overall, the market sold off in a tight bear channel, indicating strong selling momentum.
The market remains Always-In-Short.
The market has formed a pullback to the 20-day EMA, followed by the start of a possible second leg sideways to down.
Today (Monday, Nov 24), traders will watch if the bears can create more follow-through selling.
Or will the market trade slightly lower, but close with a long tail below candlesticks, which can indicate some profit-taking activity?
Andrew

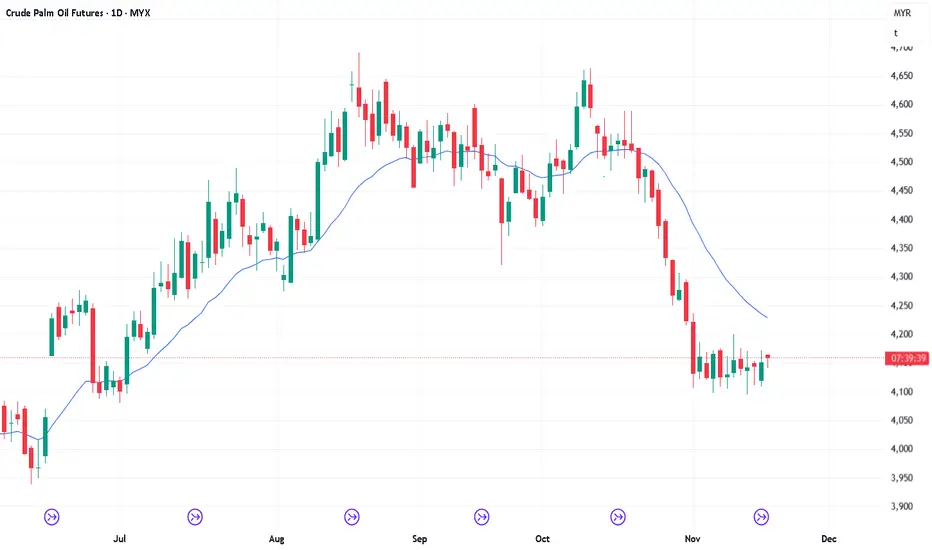
FCPO Week 48 205: Another consolidation mode?Still in bearish mode but the move lower is losing a little bit of momentum even though Friday push lower look impressive. Look at 4H and you will see a bullish divergence that might indicate that price will retrace in a bearish macro trend. Another consolidation period is also possible. So bearish on higher timeframe but bearish in 4H is losing momentum and retracement or consolidation is a possibility.

20/11/25 PB to 20-Day EMA, Retest Low
Wednesday’s candlestick (Nov 19) was a bull bar closing in its lower half with a long tail above.
In our previous report, we said traders would watch if the bulls could get a strong follow-through bull bar, closing above the 20-day EMA, or if the candlestick will close below the middle of its range, and with a long tail above.
The market tested the 20-day EMA, but reversed to close below it.
The bulls hope the current decline will form a major higher low.
They want a pullback to the 20-day EMA. They got what they wanted in Tuesday's session.
If the market trades lower, they want it to form a higher low, followed by a second leg sideways to up.
They want the previous tight trading range to act as support.
They must now produce strong consecutive bull bars to show they are clearly in control.
The bears’ measured-move target, based on the height of the prior trading range, projects toward the 4000–3950 area.
The selloff formed a tight bear channel, indicating strong bearish sentiment and persistent selling pressure.
They see the recent move (Nov 19) as a pullback. They want it to stall around the 20-day EMA, followed by a second leg sideways to down.
At the least, they want a retest of the November 18 low, even if it only forms a higher low. The move is underway.
Fundamentals
• Production: SPPOMA about flat in the first 15 days.
• Refineries: Buying interest remains, though not paying premiums vs spot futures.
• Exports: ITS said exports are down 15.50% in the first 15 days.
Overall, the market sold off in a tight bear channel, indicating strong selling momentum.
The market remains Always-In-Short.
The selloff, however, is slightly climactic and has a parabolic wedge shape. The market may need to form a minor pullback before resuming its decline.
The market has formed a pullback to the 20-day EMA yesterday.
For now, odds still slightly favor the first pullback being minor, followed by a retest of the Nov 18 low, even if it only forms a higher low. This remains true.
Today (Thursday, Nov 20), traders will watch if the bears can get a strong retest of the November low, trading back into the tight trading range.
Or will the market trade slightly lower, but close with a long tail below?
Andrew

19/11/25 BO Above TTR, Test 20-EMA, Bulls Need FT Buying
Tuesday’s candlestick (Nov 18) was a bull bar closing near its high with a small tail above.
In our previous report, we said traders would watch whether the market continues to chop sideways within the tight trading range formed in the last 10 trading days, or if the market breaks from either direction. Expect breakouts from trading ranges to fail 80-90% of the time.
The market formed a breakout above the tight trading range.
The bulls hope the current decline will form a major higher low.
They want a pullback to the 20-day EMA. They got what they wanted in Tuesday night's session.
They must now produce strong consecutive bull bars to show they are clearly in control.
If the market trades lower, they want it to form a higher low, followed by a second leg sideways to up.
The bears’ measured-move target, based on the height of the prior trading range, projects toward the 4000–3950 area.
The selloff formed a tight bear channel, indicating strong bearish sentiment and persistent selling pressure.
They see the current move as a pullback. They want it to stall around the 20-day EMA, followed by a second leg sideways to down.
At the least, they want a retest of the November 18 low, even if it only forms a higher low.
Fundamentals
• Production: SPPOMA about flat in the first 15 days.
• Refineries: Buying interest remains, though not paying premiums vs spot futures.
• Exports: ITS said exports are down 15.50% in the first 15 days.
Overall, the market sold off in a tight bear channel, indicating strong selling momentum.
The market remains Always-In-Short.
The selloff, however, is slightly climactic and has a parabolic wedge shape. The market may need to form a minor pullback before resuming its decline.
The market has formed a pullback to the 20-day EMA today.
For now, odds still slightly favor the first pullback being minor, followed by a retest of the Nov 18 low, even if it only forms a higher low.
Today (Wednesday, Nov 19), traders will watch if the bulls can get a strong follow-through bull bar, closing above the 20-day EMA.
Or if the candlestick will close below the middle of its range, and with a long tail above?
Andrew

18/11/25 No Breakout from Sideways Tight Trading Range Yet
Monday’s candlestick (Nov 17) was an outside bull bar closing in its upper half with a prominent tail above.
In our previous report, we said traders would watch whether the market continues to chop sideways within the tight trading range formed in the last 9 trading days, or if the market would break from either direction. Expect breakouts from trading ranges to fail 80-90% of the time.
The market remains in the tight trading range, testing its upper third.
The bulls hope the current decline will form a major higher low.
If the market trades lower, they want the recent sideways consolidation to be the final flag of the move.
They want a pullback to the 20-day EMA.
The problem with the bull's case is that they haven't been able to create strong bull bars to show control.
They must now produce strong consecutive bull bars, clearly breaking above the tight trading range with follow-through buying.
The bears’ measured-move target, based on the height of the prior trading range, projects toward the 4000–3950 area.
The selloff formed a tight bear channel, showing strong bears and persistent selling pressure.
They see the current tight trading range as a pullback. They want a breakout below, followed by another strong leg down.
If the market trades higher, the bears want it to stall around 4200 or the 20-day EMA, then resume its decline.
Fundamentals
• Production: SPPOMA about flat in the first 15 days.
• Refineries: Buying interest remains, though not paying premiums vs spot futures.
• Exports: ITS said exports are down 15.50% in the first 15 days.
Overall, the market sold off in a tight bear channel — evidence of strong selling momentum.
The market remains Always-In-Short.
The selloff, however, is slightly climactic and has a parabolic wedge shape. The market may need to form a minor pullback before resuming its decline.
However, the bulls have not yet been able to create decent buying pressure.
The bulls need to do more to show they are at least temporarily back in control by creating consecutive strong bull bars. Otherwise, traders will not be willing to buy aggressively.
If the pullback remains sideways and the bulls fail to create strong bull bars, the odds of another leg down towards 4000 will increase in the days/weeks ahead.
For now, odds still slightly favor the first pullback being minor.
Today (Tuesday, Nov 18), traders will watch whether the market continues to chop sideways within the tight trading range formed in the last 10 trading days.
Or if the market breaks from either direction. Expect breakouts from trading ranges to fail 80-90% of the time.
Andrew
Is CPO Malaysia can Breaout 2022 Resistance?Soon MYX:FCPO1! will test it's long term Resistance (since 2022) at MYR4,500.
The question, can it Breakout now?
Try to look at Monthly Chart and you will see that since 2022, CPO Malaysia has been Up Trending according to SMA60. You can expect the fall from early 2022 up to now is within Technical Correction phase.
And the time is up.
I predict CPO Malaysia will Breakout MYR4,500 soon, help by La Nina potential.
