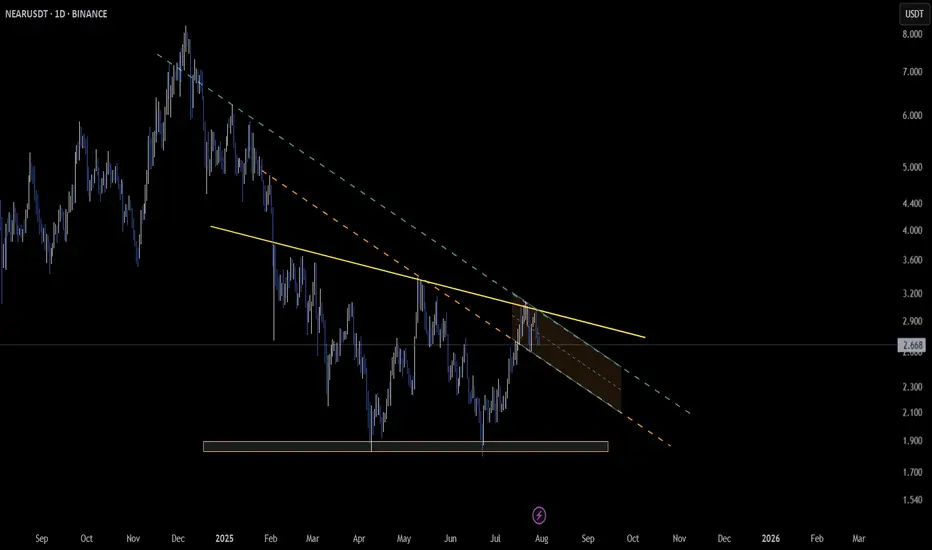
NEAR 4H – Squeezed Into Support, But Will the Bounce Stick? NEAR is being compressed between a major descending trendline and a historically strong demand zone on the 4H.
The setup is classic:
🔻 Lower highs = sustained bearish pressure
🔹 Flat support = buyer interest around $1.50–$2.00
🔄 Stoch RSI is flipping from oversold, hinting at possible relief
A cle
Related pairs

Short on NEAR, but with caution!The technical setup is very clear and strong. The resistance level is well-defined. The fundamental news, while positive, is not reporting the kind of extreme, immediate buying pressure we saw with ENA. The news about developer activity is a long-term positive, but it doesn't invalidate a potential
NEAR Approaching Key Breakout Zone – Structure TighteningCBOE:NEAR is showing mixed signals across timeframes 🧠
On the daily chart, price is moving within a descending triangle 📉 — often a bearish continuation setup.
However, from a different angle, it also appears to have broken above the trendline and retested it ✅ — suggesting early signs of a potent
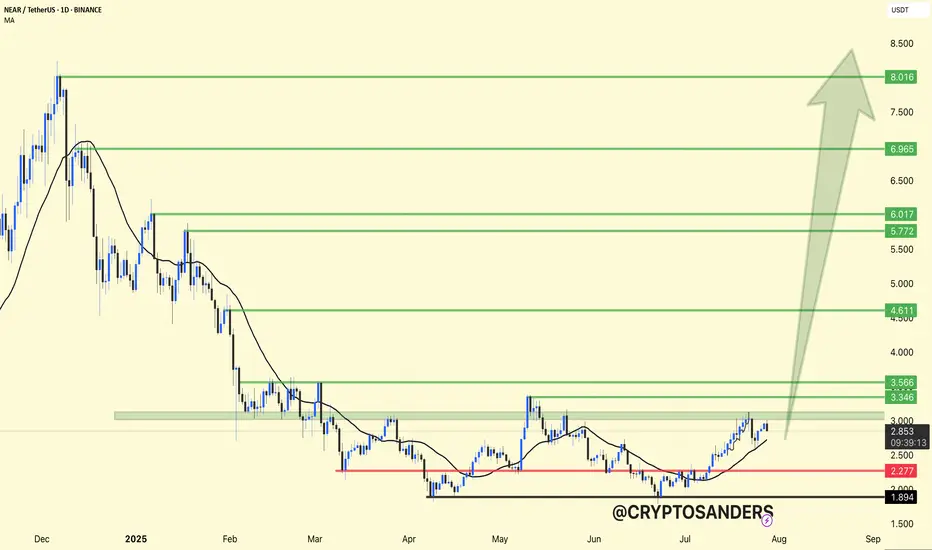
NEAR/USDT Daily Chart Update & Long Setup:NEAR has broken out of its accumulation zone and is now trading above the key support level of $2.27, with a clean higher-low structure forming.
Support Zone: $2.27
Immediate Resistance: $3.34 – $3.56
Breakout Confirmation Target: $4.61 → $5.77 → $6.96 → $8.01+
Long Trade Setup (Swing Idea):
Entry
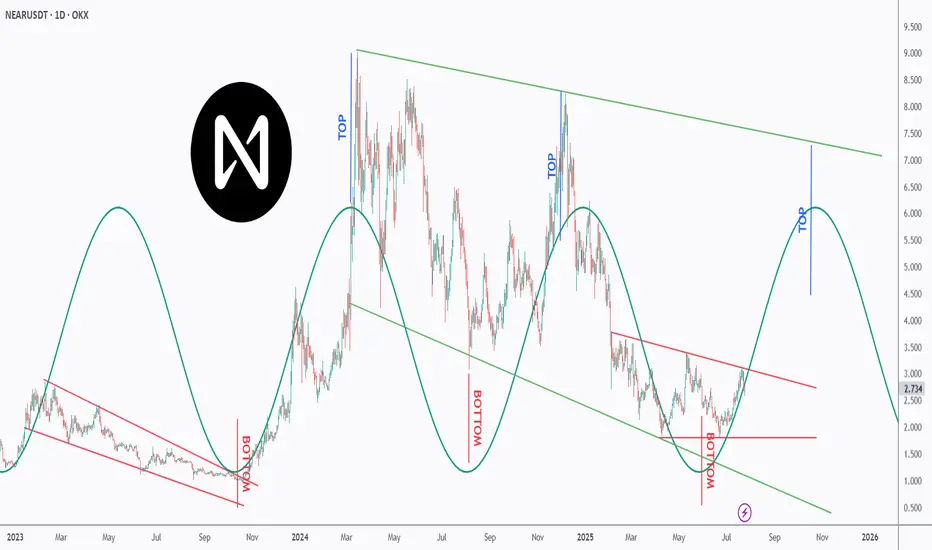
Is NEAR NEARing Its Next Explosion? Watch This Perfect Pattern!NEAR is dancing to a powerful rhythm — and it’s all in the cycles 🔁
This chart uncovers a repeating top-bottom cycle that has held since early 2023, with precise peaks and valleys emerging every few months 📉📈.
After bouncing off a major bottom at ~$2, NEAR is now approaching the mid-line of the d
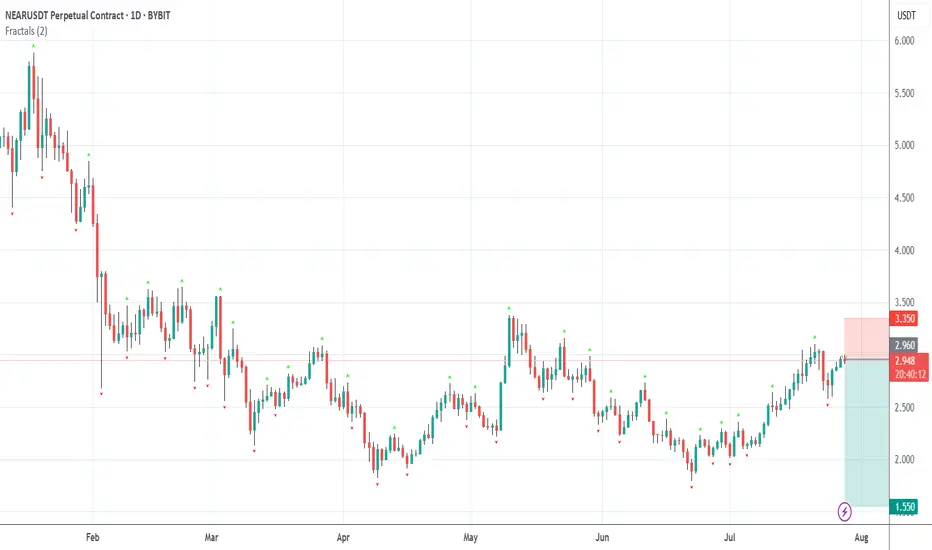
NEAR 4H – Key Support Holding, But Will It Last?NEAR is approaching a key inflection point on the 4H timeframe. After breaking above the $2.68–2.70 range — a level that acted as major resistance throughout May and early June — price is now retesting it as support. This kind of structure flip is often seen at critical turning points in a trend, es

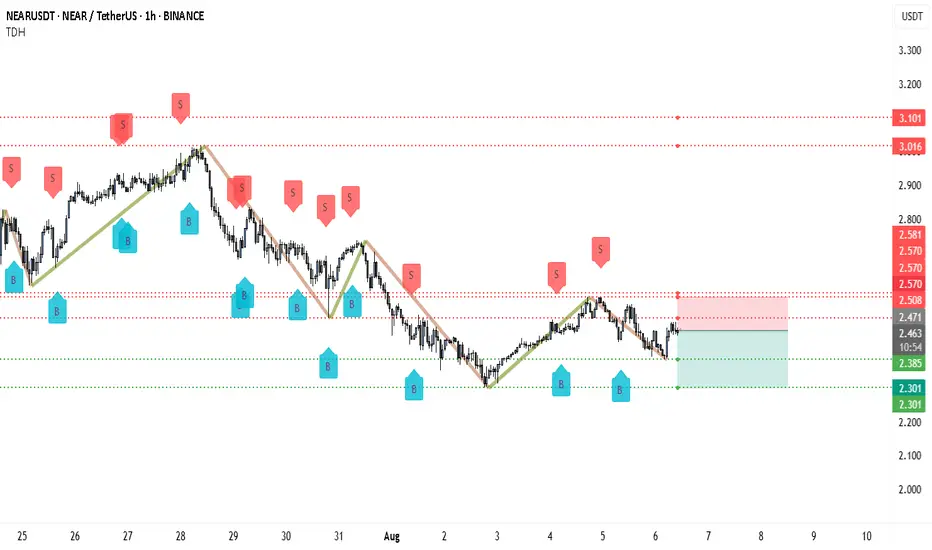
From $2.47 to $2.20 — Is NEAR Headed for a Sharp Selloff?NEAR is currently facing heavy selling pressure after failing to break above the $2.508–$2.570 resistance zone. This zone has acted as a strong supply area, with multiple “S” sell signals appearing here in recent sessions. The rejection from this level aligns with the broader downtrend structure tha
NEAR is unreasonably one of the lowest stillHowever I can see it is trying to grind higher and their community have bee jumping in with buys. The 1H mean is supportive of perhaps a change in its low position and depressed percentage losses over the last 24 hours comparatively to other no brand coins. Fundamentals aside, I think it may retest

NEAR Swing Long Idea - Altseason 2025📌 Fundamental Sentiment:
The entire crypto market is rallying, alongside other risk assets. This is mainly driven by U.S. policy expectations — Trump is pressuring Powell to resign and aggressively pushing for rate cuts from the Federal Reserve.
📌 Technical Analysis:
NEAR has recently broken and cl

Near is preparing for an bullish move soonNear is preparing for an bullish move soon
The price broke out from a strong channel pattern.
Given that BTC is making a pause NEAR is possible to correct near to 2.37 before it moves up more as shown on the chart.
I am looking at for normal targets but it can make also a bigger movement as well.

See all ideas
Summarizing what the indicators are suggesting.
Oscillators
Neutral
SellBuy
Strong sellStrong buy
Strong sellSellNeutralBuyStrong buy
Oscillators
Neutral
SellBuy
Strong sellStrong buy
Strong sellSellNeutralBuyStrong buy
Summary
Neutral
SellBuy
Strong sellStrong buy
Strong sellSellNeutralBuyStrong buy
Summary
Neutral
SellBuy
Strong sellStrong buy
Strong sellSellNeutralBuyStrong buy
Summary
Neutral
SellBuy
Strong sellStrong buy
Strong sellSellNeutralBuyStrong buy
Moving Averages
Neutral
SellBuy
Strong sellStrong buy
Strong sellSellNeutralBuyStrong buy
Moving Averages
Neutral
SellBuy
Strong sellStrong buy
Strong sellSellNeutralBuyStrong buy
Displays a symbol's price movements over previous years to identify recurring trends.
Curated watchlists where NEARUSDT is featured.

Gen 3 crypto: A new day dawns…
25 No. of Symbols

Smart contracts: Make the smart decision
36 No. of Symbols
See all sparks
Frequently Asked Questions
The current price of NEAR / TetherUS (NEAR) is 2.492 USDT — it has risen 0.85% in the past 24 hours. Try placing this info into the context by checking out what coins are also gaining and losing at the moment and seeing NEAR price chart.
NEAR / TetherUS price has fallen by −8.59% over the last week, its month performance shows a 14.17% increase, and as for the last year, NEAR / TetherUS has decreased by −32.25%. See more dynamics on NEAR price chart.
Keep track of coins' changes with our Crypto Coins Heatmap.
Keep track of coins' changes with our Crypto Coins Heatmap.
NEAR / TetherUS (NEAR) reached its highest price on Jan 14, 2022 — it amounted to 20.597 USDT. Find more insights on the NEAR price chart.
See the list of crypto gainers and choose what best fits your strategy.
See the list of crypto gainers and choose what best fits your strategy.
NEAR / TetherUS (NEAR) reached the lowest price of 0.525 USDT on Nov 4, 2020. View more NEAR / TetherUS dynamics on the price chart.
See the list of crypto losers to find unexpected opportunities.
See the list of crypto losers to find unexpected opportunities.
The safest choice when buying NEAR is to go to a well-known crypto exchange. Some of the popular names are Binance, Coinbase, Kraken. But you'll have to find a reliable broker and create an account first. You can trade NEAR right from TradingView charts — just choose a broker and connect to your account.
Crypto markets are famous for their volatility, so one should study all the available stats before adding crypto assets to their portfolio. Very often it's technical analysis that comes in handy. We prepared technical ratings for NEAR / TetherUS (NEAR): today its technical analysis shows the sell signal, and according to the 1 week rating NEAR shows the sell signal. And you'd better dig deeper and study 1 month rating too — it's sell. Find inspiration in NEAR / TetherUS trading ideas and keep track of what's moving crypto markets with our crypto news feed.
NEAR / TetherUS (NEAR) is just as reliable as any other crypto asset — this corner of the world market is highly volatile. Today, for instance, NEAR / TetherUS is estimated as 1.25% volatile. The only thing it means is that you must prepare and examine all available information before making a decision. And if you're not sure about NEAR / TetherUS, you can find more inspiration in our curated watchlists.
You can discuss NEAR / TetherUS (NEAR) with other users in our public chats, Minds or in the comments to Ideas.