NEAR Protocol Long Trade Setup on 4-Hour TimeframeTrade Setup Details
Direction: Long (buy).
Entry Trigger: Enter on a confirmed breakout above the upper trendline of the falling wedge, ideally around $1.60-$1.65, with a 4H candle close above and accompanying volume increase. Wait for confirmation to avoid false breaks.
Stop Loss: Set at $1.45 (ju
Related pairs

NEAR USDT LONG SIGNAL---
📢 Trade Signal – NEAR/USDT
📈 Position Type: LONG
💰 Entry Price: 1.814
---
🎯 Take-Profit Targets (Partial Exits)
TP1 = 1.845
TP2 = 1.900
TP3 = 1.988
TP4 = —
TP5 = —
---
🛑 Stop-Loss: 1.789
📊 Timeframe: 15m
⚖️ Risk/Reward Ratio: 6.65
💥 Suggested Leverage: 5× – 10×
---
🧠 Technical Analys

NEAR Trend Reversal | Sellers Breaking Down (4H)We have a bullish CH (Change of Character) on the chart, which is the first sign of a trend reversal. Note that this trend change is referring to hourly timeframes trend reversals always start from lower timeframes.
It is also located on a key level. This is the same shadow low (wick) that price pr

NEAR protocol price analysis#NEARprotocol: early signs of stabilization after a prolonged correction
On the OKX:NEARUSDT chart, price action shows several notable technical elements worth monitoring.
trading volumes remain relatively stable, despite broader market weakness.
price is currently respecting a descending tre

NEAR / USDT – 1HNEAR / USDT – 1H
Bullish context remains intact.
On Total Market Cap we saw a clear 4H MSS close, followed by a clean 50% retrace.
NEAR is showing the same structure and reaction.
Price is currently reacting from the 50% retracement / discount zone, with support holding.
As long as this level hold
NEAR / USDT – Long IdeaPrice has retraced ~50% after a 4H MSS, which often acts as a premium entry zone.
On the 15M we now see a fresh MSS, confirming short-term bullish structure.
Key levels
• Entry: current / slight pullback
• Invalidation: below local low
• Target: previous highs & liquidity above
Why this setup

NEAR USDT SHORT SIGNAL📢 Official Trade Signal – NEAR/USDT
📉 Position Type: SHORT
💰 Entry Price: 1.452 /
1.479 (Limit Order)
🎯 Take-Profit Targets (Partial Exits):
• TP1: 1.413
• TP2: 1.362
• TP3: 1.314
• TP4: 1.265
• TP5: —
🛑 Stop-Loss: 1.540
📊 Timeframe: 15m
⚖️ Risk/Reward Ratio: —
💥 Suggested Leverage: 5× or 3×
🧠 Tec

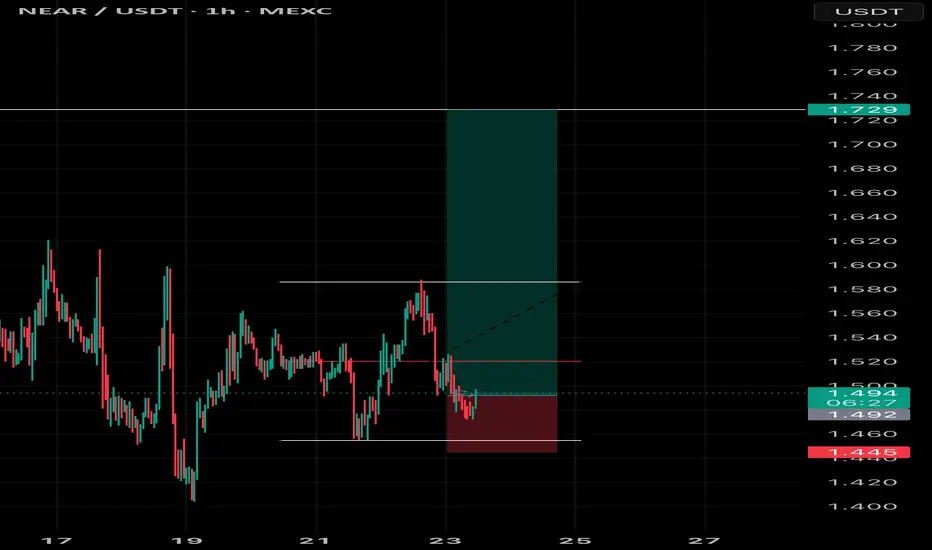
NEAR USDT LONG SIGNAL---
📢 #Official Trade Signal – NEAR/USDT
📈 Position Type: LONG
💰 Entry Price: 1.538 (Limit Order)
---
🎯 Take-Profit Targets (Partial Exits)
• TP1: 1.577
• TP2: 1.624
• TP3: 1.673
• TP4: 1.723
• TP5: —
• TP6: —
---
🛑 Stop-Loss: 1.485
📊 Timeframe: 15m
⚖️ Risk/Reward Ratio: —
💥 Suggested Lever

$NEAR 15 MINUTS CHART UPDATE 📌 CBOE:NEAR is showing a short-term price increase on the 15 MINUTES CHART ✅
📌If CBOE:NEAR continues to hold above the SUPPORT ZONE in green below, the price will continue to rise 🚀💸

NearDear Traders
here my analysis for Near on 4 hours this trade should be fast
look at the stockastic going up but based on my analysis u will see how it will follow
never trust indicators :)
lets see if it can play like and comment if you like :D

See all ideas
Summarizing what the indicators are suggesting.
Oscillators
Neutral
SellBuy
Strong sellStrong buy
Strong sellSellNeutralBuyStrong buy
Oscillators
Neutral
SellBuy
Strong sellStrong buy
Strong sellSellNeutralBuyStrong buy
Summary
Neutral
SellBuy
Strong sellStrong buy
Strong sellSellNeutralBuyStrong buy
Summary
Neutral
SellBuy
Strong sellStrong buy
Strong sellSellNeutralBuyStrong buy
Summary
Neutral
SellBuy
Strong sellStrong buy
Strong sellSellNeutralBuyStrong buy
Moving Averages
Neutral
SellBuy
Strong sellStrong buy
Strong sellSellNeutralBuyStrong buy
Moving Averages
Neutral
SellBuy
Strong sellStrong buy
Strong sellSellNeutralBuyStrong buy
Displays a symbol's price movements over previous years to identify recurring trends.
Curated watchlists where NEARUSDT is featured.

Gen 3 crypto: A new day dawns…
25 No. of Symbols

Smart contracts: Make the smart decision
36 No. of Symbols
See all sparks
Frequently Asked Questions
The current price of NEAR / USDT (NEAR) is 1.511 USDT — it has fallen −2.31% in the past 24 hours. Try placing this info into the context by checking out what coins are also gaining and losing at the moment and seeing NEAR price chart.
NEAR / USDT price has fallen by −0.27% over the last week, its month performance shows a −17.84% decrease, and as for the last year, NEAR / USDT has decreased by −69.21%. See more dynamics on NEAR price chart.
Keep track of coins' changes with our Crypto Coins Heatmap.
Keep track of coins' changes with our Crypto Coins Heatmap.
NEAR / USDT (NEAR) reached its highest price on Jan 14, 2022 — it amounted to 20.480 USDT. Find more insights on the NEAR price chart.
See the list of crypto gainers and choose what best fits your strategy.
See the list of crypto gainers and choose what best fits your strategy.
NEAR / USDT (NEAR) reached the lowest price of 0.400 USDT on Oct 14, 2020. View more NEAR / USDT dynamics on the price chart.
See the list of crypto losers to find unexpected opportunities.
See the list of crypto losers to find unexpected opportunities.
The safest choice when buying NEAR is to go to a well-known crypto exchange. Some of the popular names are Binance, Coinbase, Kraken. But you'll have to find a reliable broker and create an account first. You can trade NEAR right from TradingView charts — just choose a broker and connect to your account.
Crypto markets are famous for their volatility, so one should study all the available stats before adding crypto assets to their portfolio. Very often it's technical analysis that comes in handy. We prepared technical ratings for NEAR / USDT (NEAR): today its technical analysis shows the sell signal, and according to the 1 week rating NEAR shows the sell signal. And you'd better dig deeper and study 1 month rating too — it's sell. Find inspiration in NEAR / USDT trading ideas and keep track of what's moving crypto markets with our crypto news feed.
NEAR / USDT (NEAR) is just as reliable as any other crypto asset — this corner of the world market is highly volatile. Today, for instance, NEAR / USDT is estimated as 1.46% volatile. The only thing it means is that you must prepare and examine all available information before making a decision. And if you're not sure about NEAR / USDT, you can find more inspiration in our curated watchlists.
You can discuss NEAR / USDT (NEAR) with other users in our public chats, Minds or in the comments to Ideas.