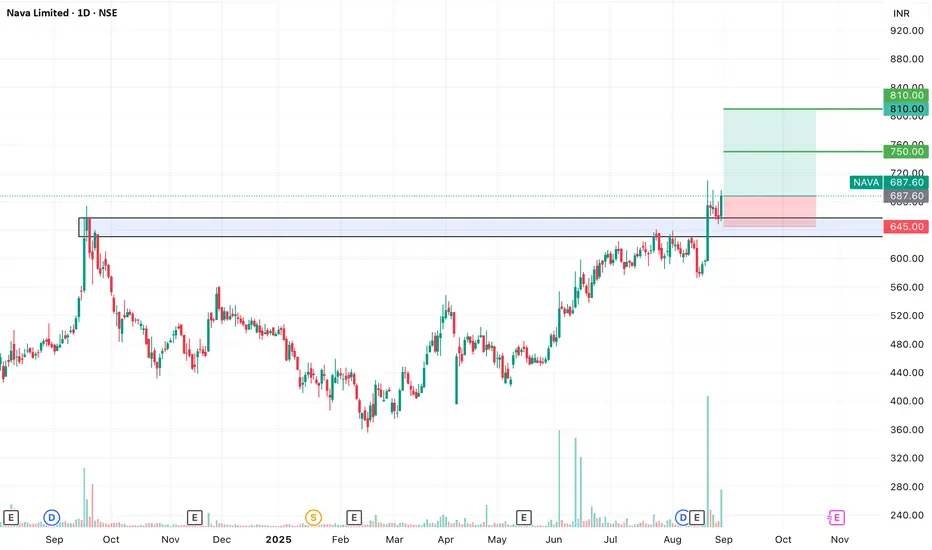
NAVA LTD S/RSupport and Resistance Levels:
Support Levels: These are price points (green line/shade) where a downward trend may be halted due to a concentration of buying interest. Imagine them as a safety net where buyers step in, preventing further decline.
Resistance Levels: Conversely, resistance levels (re
Nava Limited
No trades
Next report date
—
Report period
—
EPS estimate
—
Revenue estimate
—
32.35 INR
10.91 B INR
39.78 B INR
134.52 M
About Nava Limited
Sector
Industry
CEO
Ashwin Devineni
Website
Headquarters
Hyderabad
Founded
1972
Identifiers
2
ISININE725A01030
Nava Ltd. engages in the power generation and agriculture businesses. It operates through the following segments: Ferro Alloys, Power, and Mining. The Ferro Alloys segment produces alloy metals, such as ferro chrome, silico manganese, and ferro silicon, and carries conversion work on job work basis to others. The Power segment generates thermal energy for captive use and also for outside sale. The Mining segment includes coal mining for captive use and also for outside sale. The company was founded on November 7, 1972 and is headquartered in Hyderabad, India.
Related stocks

SWING IDEA - NAVA Nava Ltd , a diversified natural resources and energy company, is showing a promising swing opportunity with a breakout backed by strong technical signals.
Reasons are listed below :
Cup and Handle breakout, a strong bullish continuation pattern
Confirmed bullish price action post breakout
Bul
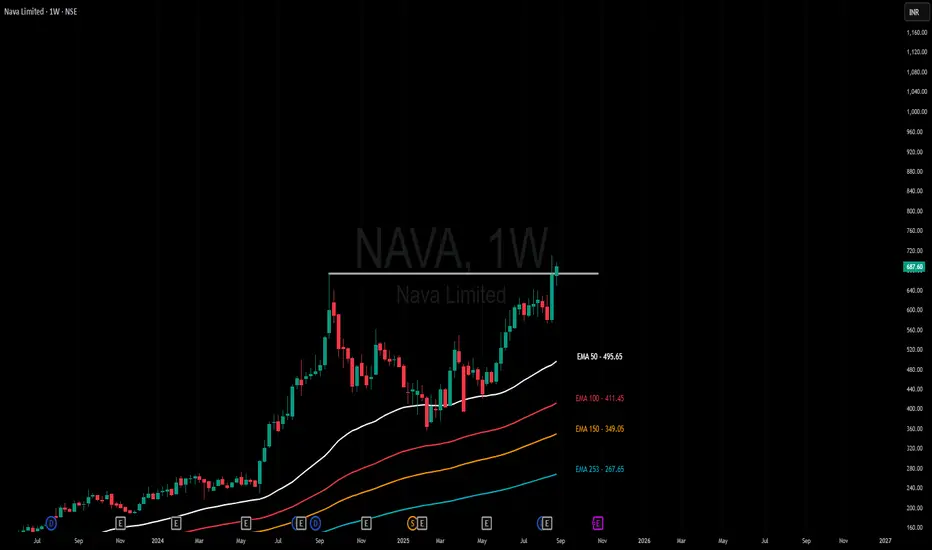
Amazing breakout on WEEKLY Timeframe - NAVACheckout an amazing breakout happened in the stock in Weekly timeframe, macroscopically seen in Daily timeframe. Having a great favor that the stock might be bullish expecting a staggering returns of minimum 25% TGT. IMPORTANT BREAKOUT LEVELS ARE ALWAYS RESPECTED!
NOTE for learners: Place the break
NAVA LtdNava Ltd
RSI Based Strategy
Daily Chart RSI taken support @ 60
Weekly / Monthly RSI above 60
Support 538
Resistance 573
1. There is also VCP pattern
2. Flag Pattern (support 9 EMA then high cross upside
3. Long leg candle also closed above 559

NAVA LIMITED – Bullish breakout in 1d soonNAVA Limited is currently exhibiting strong bullish momentum, supported by both technical indicators and improving fundamentals. The stock has shown a sustained uptrend with higher highs and strong volumes, indicating buyer dominance.
✅ Key Bullish Factors:
📊 Strong Fundamentals: Consistent profit

NavaNAVA is looking strong – good momentum building up here. Worth keeping an eye on for potential upside. 📈

fantastic chart and fundamentalFantastic fundamentals, sales, and profit VAR%.
Have a strong bullish veiw on this chart.

NAVA Trading Above Fresh Demand ZoneNAVA is currently trading at ₹972.4, above its fresh demand zone between ₹954.9 and ₹923.65, established on 25th November 2024. This untested zone indicates potential buying interest. Investors may watch for price movements near this zone to assess trading opportunities.
Disclaimer: This analysis i


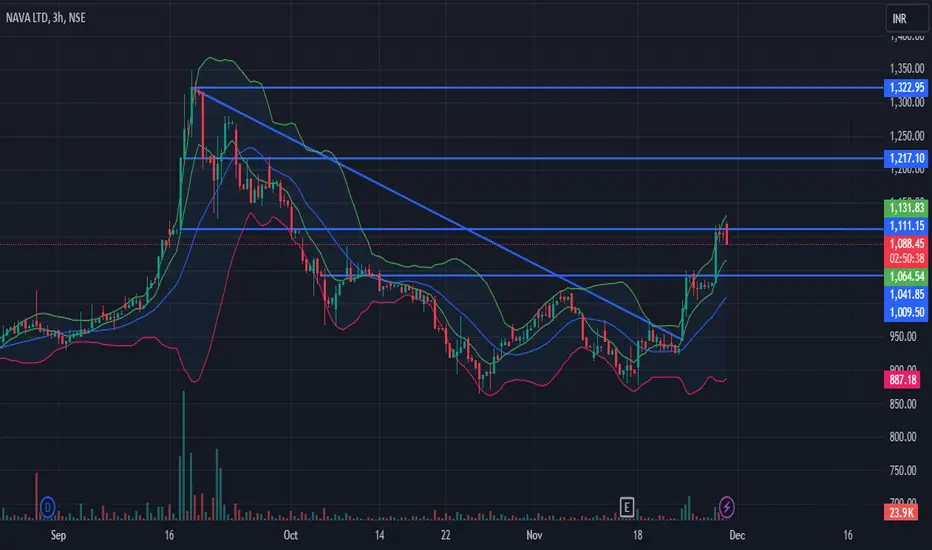
NAVA CMP 1085NAVA LTD is good fundamentally strong company with the PE of 15,ROCE-16,ROCE-18.It shows that company in trading at fair value price.If sustain above 1100 than we can see a good upmove for next resistance level-1300. Keep waching and add to your wachlist.Decide your Risk and Reward levels Thank You.
See all ideas
Summarizing what the indicators are suggesting.
Oscillators
Neutral
SellBuy
Strong sellStrong buy
Strong sellSellNeutralBuyStrong buy
Oscillators
Neutral
SellBuy
Strong sellStrong buy
Strong sellSellNeutralBuyStrong buy
Summary
Neutral
SellBuy
Strong sellStrong buy
Strong sellSellNeutralBuyStrong buy
Summary
Neutral
SellBuy
Strong sellStrong buy
Strong sellSellNeutralBuyStrong buy
Summary
Neutral
SellBuy
Strong sellStrong buy
Strong sellSellNeutralBuyStrong buy
Moving Averages
Neutral
SellBuy
Strong sellStrong buy
Strong sellSellNeutralBuyStrong buy
Moving Averages
Neutral
SellBuy
Strong sellStrong buy
Strong sellSellNeutralBuyStrong buy
Displays a symbol's price movements over previous years to identify recurring trends.
SMALLCAP
Mirae Asset Nifty Smallcap 250 Momentum Quality 100 ETF Units Exchange Traded FundWeight
1.05%
Market value
840.05 K
USD
Explore more ETFs
Frequently Asked Questions
The current price of NAVA is 577.65 INR — it has increased by 1.60% in the past 24 hours. Watch Nava Limited stock price performance more closely on the chart.
Depending on the exchange, the stock ticker may vary. For instance, on NSE exchange Nava Limited stocks are traded under the ticker NAVA.
NAVA stock has risen by 0.92% compared to the previous week, the month change is a 5.19% rise, over the last year Nava Limited has showed a 16.23% increase.
NAVA reached its all-time high on Sep 15, 2025 with the price of 735.00 INR, and its all-time low was 16.00 INR and was reached on Mar 24, 2020. View more price dynamics on NAVA chart.
See other stocks reaching their highest and lowest prices.
See other stocks reaching their highest and lowest prices.
NAVA stock is 3.09% volatile and has beta coefficient of 1.33. Track Nava Limited stock price on the chart and check out the list of the most volatile stocks — is Nava Limited there?
Today Nava Limited has the market capitalization of 160.72 B, it has increased by 0.64% over the last week.
Yes, you can track Nava Limited financials in yearly and quarterly reports right on TradingView.
Nava Limited is going to release the next earnings report on Jan 30, 2026. Keep track of upcoming events with our Earnings Calendar.
NAVA net income for the last quarter is 1.29 B INR, while the quarter before that showed 3.08 B INR of net income which accounts for −57.96% change. Track more Nava Limited financial stats to get the full picture.
Nava Limited dividend yield was 1.54% in 2024, and payout ratio reached 21.26%. The year before the numbers were 0.82% and 12.30% correspondingly. See high-dividend stocks and find more opportunities for your portfolio.
As of Dec 19, 2025, the company has 1.13 K employees. See our rating of the largest employees — is Nava Limited on this list?
EBITDA measures a company's operating performance, its growth signifies an improvement in the efficiency of a company. Nava Limited EBITDA is 17.35 B INR, and current EBITDA margin is 46.52%. See more stats in Nava Limited financial statements.
Like other stocks, NAVA shares are traded on stock exchanges, e.g. Nasdaq, Nyse, Euronext, and the easiest way to buy them is through an online stock broker. To do this, you need to open an account and follow a broker's procedures, then start trading. You can trade Nava Limited stock right from TradingView charts — choose your broker and connect to your account.
Investing in stocks requires a comprehensive research: you should carefully study all the available data, e.g. company's financials, related news, and its technical analysis. So Nava Limited technincal analysis shows the buy rating today, and its 1 week rating is buy. Since market conditions are prone to changes, it's worth looking a bit further into the future — according to the 1 month rating Nava Limited stock shows the buy signal. See more of Nava Limited technicals for a more comprehensive analysis.
If you're still not sure, try looking for inspiration in our curated watchlists.
If you're still not sure, try looking for inspiration in our curated watchlists.