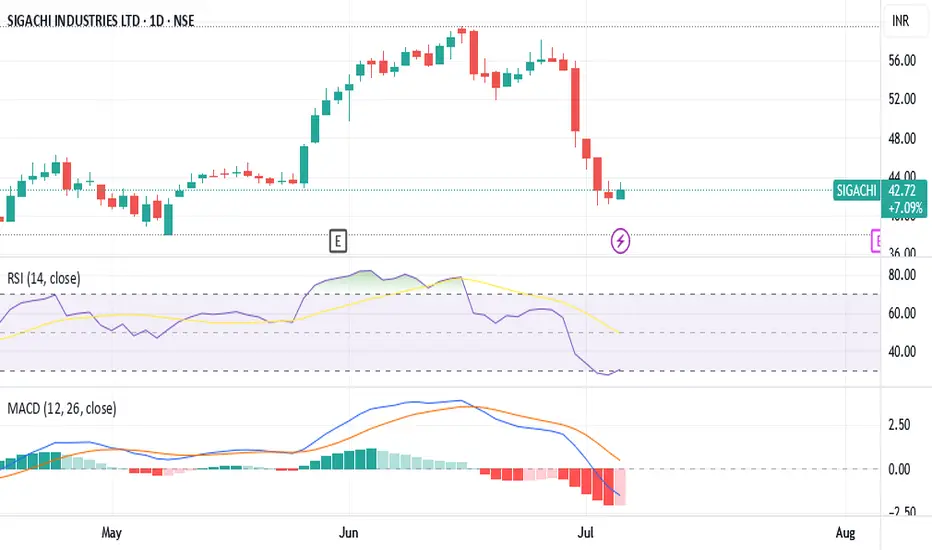
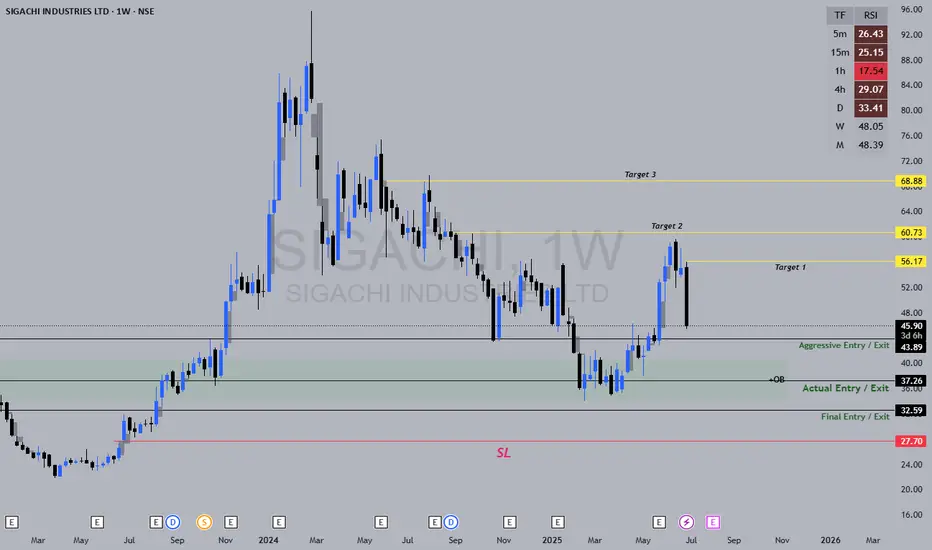
Buy/Sell or SKIP? The Truth About Fake Breakouts you must knowNot every breakout leads to profits—some are traps waiting to catch unprepared traders. This video reveals the critical multi-timeframe logic needed to separate genuine opportunities from fake breakouts.
Chart used is 3 months old for educational purposes only.
Sigachi Industries Limited
No trades
Next report date
—
Report period
—
EPS estimate
—
Revenue estimate
—
−1.35 INR
695.63 M INR
4.88 B INR
185.16 M
About Sigachi Industries Limited
Sector
Industry
CEO
Amit Raj Sinha
Website
Headquarters
Hyderabad
Founded
1989
Identifiers
2
ISININE0D0K01022
Sigachi Industries Ltd. engages in the manufacture and sale of microcrystalline cellulose. Its product is used as an excipient for finished dosages in the pharmaceutical, food, nutraceuticals, and cosmetic industries, as a stabilizer, anti-caking agent, fat substitute, and emulsifier in food industry and as a fat substitute, thickener, and binder in cosmetics. The company was founded on January 11, 1989 and is headquartered in Hyderabad, India.
Related stocks

Sigachi Industries Ltd - Special Situation Explosion at the Sigachi Industries' pharma plant in Pashamylaram, Telangana
I feel company fundamentals are good. Explosion at the Sigachi would be the opportunity to get in the good stock at lower level, as there are some damage due to explosion, we need to stick on stop loses.
Sigachi Industri
SIGACHISIGACHI, watch above levels. redline is our SL.
DISCLAIMER : I am NOT a SEBI registered advisor or a financial adviser. All the views are for educational purpose only.

SIGACHIHi guys,
In this chart i Found a Demand Zone in SIGACHI CHART for Positional entry,
Observed these Levels based on price action and Demand & Supply.
*Don't Take any trades based on this Picture.
... because this chart is for educational purpose only not for Buy or Sell Recommendation..

SIGACHIHi guys,
In this chart i Found a Demand Zone in SIGACHI CHART for Positional entry,
Observed these Levels based on price action and Demand & Supply.
*Don't Take any trades based on this Picture.
... because this chart is for educational purpose only not for Buy or Sell Recommendation..

SIGACHI Industry IPO based strategy
Round bottom pattern
RSI above 60 daily / weekly / Monthly
moving averages in line 21/50/200

SIGACHI IS TOOOO BULLISHsigach ind. has formed a great rounding botton or cup and handle pattern in weekly TF and also broke the all time high and the IPO LISTING price and now ready to touch new highs

SIGACHI : Reversal from Major support SIGACHI reversing from Major support. R:R is wonderful here. study at your end and share your view

#Large Rounding bottom near breakout also facing Monthly Supply This is Sugachi Monthly Chart making large rounding botton with excellent monthly volume.Now stock is near resistance n in Supply Zone .Stock needed to breakout Rs 52 to regain Momentum

See all ideas
Summarizing what the indicators are suggesting.
Oscillators
Neutral
SellBuy
Strong sellStrong buy
Strong sellSellNeutralBuyStrong buy
Oscillators
Neutral
SellBuy
Strong sellStrong buy
Strong sellSellNeutralBuyStrong buy
Summary
Neutral
SellBuy
Strong sellStrong buy
Strong sellSellNeutralBuyStrong buy
Summary
Neutral
SellBuy
Strong sellStrong buy
Strong sellSellNeutralBuyStrong buy
Summary
Neutral
SellBuy
Strong sellStrong buy
Strong sellSellNeutralBuyStrong buy
Moving Averages
Neutral
SellBuy
Strong sellStrong buy
Strong sellSellNeutralBuyStrong buy
Moving Averages
Neutral
SellBuy
Strong sellStrong buy
Strong sellSellNeutralBuyStrong buy
Displays a symbol's price movements over previous years to identify recurring trends.
Frequently Asked Questions
The current price of SIGACHI is 31.34 INR — it has increased by 2.35% in the past 24 hours. Watch Sigachi Industries Limited stock price performance more closely on the chart.
Depending on the exchange, the stock ticker may vary. For instance, on NSE exchange Sigachi Industries Limited stocks are traded under the ticker SIGACHI.
SIGACHI stock has fallen by −8.87% compared to the previous week, the month change is a −12.41% fall, over the last year Sigachi Industries Limited has showed a −37.93% decrease.
SIGACHI reached its all-time high on Feb 27, 2024 with the price of 95.90 INR, and its all-time low was 21.98 INR and was reached on Mar 29, 2023. View more price dynamics on SIGACHI chart.
See other stocks reaching their highest and lowest prices.
See other stocks reaching their highest and lowest prices.
SIGACHI stock is 2.75% volatile and has beta coefficient of 1.74. Track Sigachi Industries Limited stock price on the chart and check out the list of the most volatile stocks — is Sigachi Industries Limited there?
Today Sigachi Industries Limited has the market capitalization of 11.71 B, it has decreased by −3.08% over the last week.
Yes, you can track Sigachi Industries Limited financials in yearly and quarterly reports right on TradingView.
Sigachi Industries Limited is going to release the next earnings report on Feb 4, 2026. Keep track of upcoming events with our Earnings Calendar.
SIGACHI net income for the last quarter is 106.89 M INR, while the quarter before that showed −1.00 B INR of net income which accounts for 110.65% change. Track more Sigachi Industries Limited financial stats to get the full picture.
Yes, SIGACHI dividends are paid annually. The last dividend per share was 0.10 INR. As of today, Dividend Yield (TTM)% is 0.33%. Tracking Sigachi Industries Limited dividends might help you take more informed decisions.
Sigachi Industries Limited dividend yield was 0.28% in 2024, and payout ratio reached 4.85%. The year before the numbers were 0.18% and 5.52% correspondingly. See high-dividend stocks and find more opportunities for your portfolio.
As of Jan 3, 2026, the company has 1.81 K employees. See our rating of the largest employees — is Sigachi Industries Limited on this list?
EBITDA measures a company's operating performance, its growth signifies an improvement in the efficiency of a company. Sigachi Industries Limited EBITDA is 933.60 M INR, and current EBITDA margin is 21.10%. See more stats in Sigachi Industries Limited financial statements.
Like other stocks, SIGACHI shares are traded on stock exchanges, e.g. Nasdaq, Nyse, Euronext, and the easiest way to buy them is through an online stock broker. To do this, you need to open an account and follow a broker's procedures, then start trading. You can trade Sigachi Industries Limited stock right from TradingView charts — choose your broker and connect to your account.
Investing in stocks requires a comprehensive research: you should carefully study all the available data, e.g. company's financials, related news, and its technical analysis. So Sigachi Industries Limited technincal analysis shows the sell today, and its 1 week rating is strong sell. Since market conditions are prone to changes, it's worth looking a bit further into the future — according to the 1 month rating Sigachi Industries Limited stock shows the sell signal. See more of Sigachi Industries Limited technicals for a more comprehensive analysis.
If you're still not sure, try looking for inspiration in our curated watchlists.
If you're still not sure, try looking for inspiration in our curated watchlists.