Go long in TEXINFRAIf TEXINFRA closes above 128 on daily frame basis, then we can expect target on the upside as: 134 & 142.
Stoploss for this investment could be placed near 118-120.
−0.33 INR
−72.11 M INR
158.74 M INR
30.68 M
About Texmaco Infrastructure & Holdings Limited
Sector
Industry
Website
Headquarters
New Delhi
Founded
1939
ISIN
INE435C01024
FIGI
BBG000D14QR1
Texmaco Infrastructure & Holdings Ltd. engages in the real estate, hydro power generation, and job work businesses in India. It operates through the following segments: Real Estate, Mini Hydro Power, Trading of Goods, Job Work Services, and Other. The company was founded on August 4, 1939 and is headquartered in New Delhi, India.
Related stocks


Long TEXINFRATEXINFRA looks good to go long on Daily TF! Please check chart for detailed analysis.
Entry: 109.80
Target: 130++
Add more above: 118.60
SL: 105 (DCB)
Let's see how our study goes!
Happy Trading

Texmaco InfraLooking good to go towards 150 levels as it breaks out Gann levels and a multiyear BO
Follow the blue horizontal levels for the traing SL and targets

15 Year's Consolidations BreakoutLarger the Consolidations Stronger the Breakout. Price consolidate in a range nearly 15 year's and finally Price break the Multiyear Range . So High probability after this Breakout we will see a strong continuation Move up to 250 .

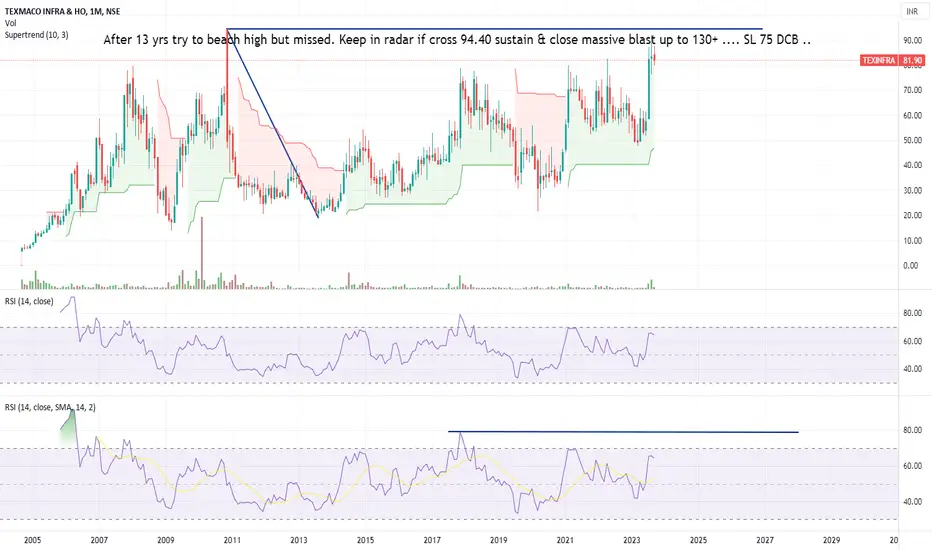
13 YR BREKOUT TRY TO BREACH TEXINFRAAfter 13 yrs try to beach high but missed. Keep in radar if cross 94.40 sustain & close massive blast up to 102.8 - 107.7 - 116.25 - 169.70 ..
Texmaco Infra
15 year breakout and a multiyear breakout above 94 would mostly result in a big rally
More volumes coming in and RSI looking perfect in all the timeframes
Good for near to medium term
PS: weekly closing should be above 91.6

TEXINFRA more than 15 years of consolidationNSE:TEXINFRA BSE:TEXINFRA
Time Frame – Monthly
Observations : -
* Consolidation & range formation seen in 15 -80 range for more than 15 years.
* Good volume activity seen in last 2 months
* Range BO and trendline breakout already done now price trying to sustain above 80
Resistance – 9

See all ideas
Summarizing what the indicators are suggesting.
Oscillators
Neutral
SellBuy
Strong sellStrong buy
Strong sellSellNeutralBuyStrong buy
Oscillators
Neutral
SellBuy
Strong sellStrong buy
Strong sellSellNeutralBuyStrong buy
Summary
Neutral
SellBuy
Strong sellStrong buy
Strong sellSellNeutralBuyStrong buy
Summary
Neutral
SellBuy
Strong sellStrong buy
Strong sellSellNeutralBuyStrong buy
Summary
Neutral
SellBuy
Strong sellStrong buy
Strong sellSellNeutralBuyStrong buy
Moving Averages
Neutral
SellBuy
Strong sellStrong buy
Strong sellSellNeutralBuyStrong buy
Moving Averages
Neutral
SellBuy
Strong sellStrong buy
Strong sellSellNeutralBuyStrong buy
Displays a symbol's price movements over previous years to identify recurring trends.
Frequently Asked Questions
The current price of TEXINFRA is 93.81 INR — it has decreased by −0.59% in the past 24 hours. Watch Texmaco Infrastructure & Holdings Limited stock price performance more closely on the chart.
Depending on the exchange, the stock ticker may vary. For instance, on NSE exchange Texmaco Infrastructure & Holdings Limited stocks are traded under the ticker TEXINFRA.
TEXINFRA stock has fallen by −2.63% compared to the previous week, the month change is a −3.86% fall, over the last year Texmaco Infrastructure & Holdings Limited has showed a −29.99% decrease.
TEXINFRA reached its all-time high on Dec 9, 2024 with the price of 159.50 INR, and its all-time low was 5.32 INR and was reached on Sep 14, 2004. View more price dynamics on TEXINFRA chart.
See other stocks reaching their highest and lowest prices.
See other stocks reaching their highest and lowest prices.
TEXINFRA stock is 1.39% volatile and has beta coefficient of 1.76. Track Texmaco Infrastructure & Holdings Limited stock price on the chart and check out the list of the most volatile stocks — is Texmaco Infrastructure & Holdings Limited there?
Today Texmaco Infrastructure & Holdings Limited has the market capitalization of 11.96 B, it has decreased by −3.11% over the last week.
Yes, you can track Texmaco Infrastructure & Holdings Limited financials in yearly and quarterly reports right on TradingView.
TEXINFRA net income for the last quarter is 33.67 M INR, while the quarter before that showed 11.25 M INR of net income which accounts for 199.23% change. Track more Texmaco Infrastructure & Holdings Limited financial stats to get the full picture.
Yes, TEXINFRA dividends are paid annually. The last dividend per share was 0.15 INR. As of today, Dividend Yield (TTM)% is 0.16%. Tracking Texmaco Infrastructure & Holdings Limited dividends might help you take more informed decisions.
As of Sep 11, 2025, the company has 28 employees. See our rating of the largest employees — is Texmaco Infrastructure & Holdings Limited on this list?
EBITDA measures a company's operating performance, its growth signifies an improvement in the efficiency of a company. Texmaco Infrastructure & Holdings Limited EBITDA is −71.36 M INR, and current EBITDA margin is −42.70%. See more stats in Texmaco Infrastructure & Holdings Limited financial statements.
Like other stocks, TEXINFRA shares are traded on stock exchanges, e.g. Nasdaq, Nyse, Euronext, and the easiest way to buy them is through an online stock broker. To do this, you need to open an account and follow a broker's procedures, then start trading. You can trade Texmaco Infrastructure & Holdings Limited stock right from TradingView charts — choose your broker and connect to your account.
Investing in stocks requires a comprehensive research: you should carefully study all the available data, e.g. company's financials, related news, and its technical analysis. So Texmaco Infrastructure & Holdings Limited technincal analysis shows the sell today, and its 1 week rating is sell. Since market conditions are prone to changes, it's worth looking a bit further into the future — according to the 1 month rating Texmaco Infrastructure & Holdings Limited stock shows the neutral signal. See more of Texmaco Infrastructure & Holdings Limited technicals for a more comprehensive analysis.
If you're still not sure, try looking for inspiration in our curated watchlists.
If you're still not sure, try looking for inspiration in our curated watchlists.