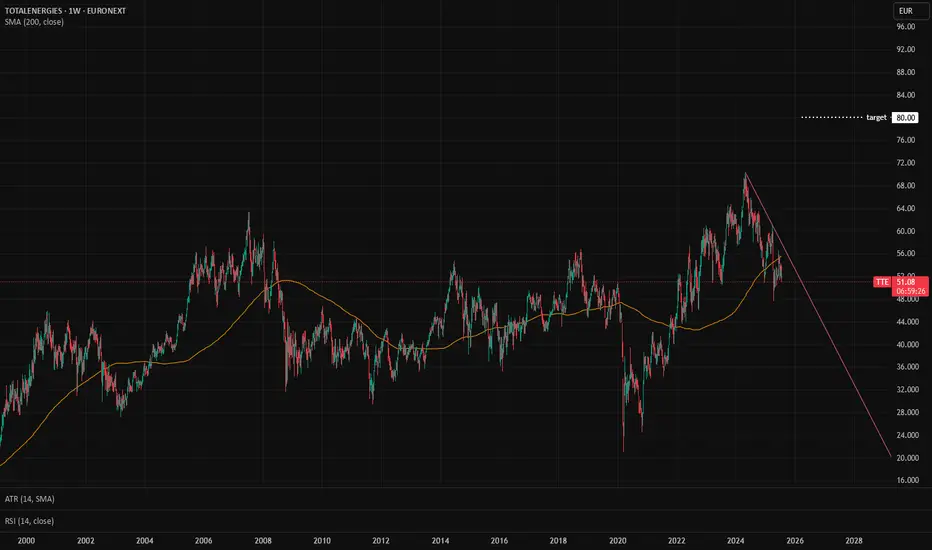
TTE: Fundamental Analysis +56 %With 2024 revenue of 195,6 billions €, Total Energies ranks among the top 10 largest energy companies in the world. EverStock identifies a fundamental revaluation potential of + 56 %.
Valuation at 7.3x net earnings
Currently valued at 115,7 billions € in market capitalization, Total Energies post
Key facts today
Next report date
—
Report period
—
EPS estimate
—
Revenue estimate
—
6.79 USD
15.08 B USD
187.21 B USD
1.99 B
About TotalEnergies SE
Sector
Industry
CEO
Patrick Pouyanné
Website
Headquarters
Courbevoie
Founded
1954
Identifiers
2
ISINFR0000120271
TotalEnergies SE is a global integrated energy company, which engages in the production of oil and biofuels, natural gas and green gases, renewables and electricity. It operates through the following business segments: Exploration & Production, Integrated LNG, Integrated Power, Refining & Chemicals, and Marketing & Services. The Exploration & Production segment encompasses oil and natural gas exploration and production activities. The Integrated LNG segment includes the integrated gas chain (including upstream and midstream LNG activities) as well as biogas, hydrogen and gas trading activities. The Integrated Power segment involves in the generation, storage, electricity trading and B2B-B2C distribution of gas and electricity. The Refining & Chemicals segment engages in the activities of refining, petrochemicals and specialty chemicals. This segment also includes the activities of oil supply, trading and marine shipping. The Marketing & Services segment includes the global activities of supply and marketing in the field of petroleum products. The company was founded on March 28, 1924 and is headquartered in Courbevoie, France.
Related stocks
TTE: Ready for a correction if the brent suffers from macro Correlation with Oil Prices:
TTE, being an oil and gas company, is closely correlated with WTI and Brent crude oil prices.
Market Uncertainty:
The fundamentals of industrial production are uncertain due to high commercial tariffs and evolving economic conditions, which could impact demand and slow

TOTAL - BREAK OF THE 63 ? After closing the session on Monday 26.08 up 1.13%, the share is now on a key level.
What's more, the downtrend line was broken yesterday.
The 63 level, which has acted as resistance for several sessions now, is once again under attack by investors. This level is also the one most traded by investo

TTE 1H Long Swing Conservative Trend tradeConservative Trend trade
+ long balance
+ ICE level
- above 1/2 correction
+ biggest volume 2 Sp
+ support level
Calcualted affordable stop loss
1 to 2 R/R take profit
Daily context:
"+ long impulse
+ 1/2 correction
+ SOS level
+ unvolumed 2Sp"
Monthly context:
"Trend Trade
+ long impulse
+ 1/2 c

TotalEnergies Surges Towards New Highs: Breakout WatchThe key technical level to watch is $63 per share. A decisive break above this resistance could trigger a fresh wave of buying, pushing the stock toward uncharted territory. Investors are advised to monitor the price action closely in the coming days to see if a breakout materializes.

TWO very POWERFUL Patterns for Trend Analysis!Hi, fellows!
In this Video we are going to talk about a great trend continuation pattern and also about a great trend reversal pattern, which you can add to your trading analysis!
Please keep in mind, that trading involves risk and that this video is for educational purpose only ;)

TotalEnergies is still in a trend channelTotalEnergies still on an uptrend, currently it its channel. I will stick to this plan EURONEXT:TTE

TTE - trading in the rangehi traders
TTE has been ranging for a while.
Let's keep it simple:
The price bounced from the support again an we're expecting a push up towards the key resistance level.
Long position can be taken now at 61.48$
target 1: 63.47$
target 2: 6450 $
stop loss: 60.50 $

$TTE with a bullish outlook following its earnings #StocksThe PEAD projected a bullish outlook for EURONEXT:TTE after a negative over reaction following its earnings release placing the stock in drift C with an expected accuracy of 85.71%.

TTE TotalEnergies SE Options Ahead of EarningsAnalyzing the options chain and the chart patterns of PTTE TotalEnergies SE prior to the earnings report this week,
I would consider purchasing the 60usd strike price Puts with
an expiration date of 2023-9-15,
for a premium of approximately $1.80.
If these options prove to be profitable prior to the

See all ideas
Summarizing what the indicators are suggesting.
Neutral
SellBuy
Strong sellStrong buy
Strong sellSellNeutralBuyStrong buy
Neutral
SellBuy
Strong sellStrong buy
Strong sellSellNeutralBuyStrong buy
Neutral
SellBuy
Strong sellStrong buy
Strong sellSellNeutralBuyStrong buy
An aggregate view of professional's ratings.
Neutral
SellBuy
Strong sellStrong buy
Strong sellSellNeutralBuyStrong buy
Neutral
SellBuy
Strong sellStrong buy
Strong sellSellNeutralBuyStrong buy
Neutral
SellBuy
Strong sellStrong buy
Strong sellSellNeutralBuyStrong buy
Displays a symbol's price movements over previous years to identify recurring trends.
TOT5885642
TotalEnergies Capital SA 5.425% 10-SEP-2064Yield to maturity
5.83%
Maturity date
Sep 10, 2064
TOT5785230
TotalEnergies Capital SA 5.638% 05-APR-2064Yield to maturity
5.81%
Maturity date
Apr 5, 2064
TOT5785229
TotalEnergies Capital SA 5.488% 05-APR-2054Yield to maturity
5.73%
Maturity date
Apr 5, 2054
TOT5006934
TotalEnergies Capital International SA 3.386% 29-JUN-2060Yield to maturity
5.70%
Maturity date
Jun 29, 2060
TOT5885641
TotalEnergies Capital SA 5.275% 10-SEP-2054Yield to maturity
5.70%
Maturity date
Sep 10, 2054
US89153VAV1
TotalEnergies Capital International SA 3.127% 29-MAY-2050Yield to maturity
5.68%
Maturity date
May 29, 2050
TOT4856890
TotalEnergies Capital International SA 3.461% 12-JUL-2049Yield to maturity
5.68%
Maturity date
Jul 12, 2049
TOT5006933
TotalEnergies Capital International SA 2.986% 29-JUN-2041Yield to maturity
5.33%
Maturity date
Jun 29, 2041
TOT5785399
TotalEnergies Capital SA 5.15% 05-APR-2034Yield to maturity
4.58%
Maturity date
Apr 5, 2034
TOT5885577
TotalEnergies Capital SA 4.724% 10-SEP-2034Yield to maturity
4.56%
Maturity date
Sep 10, 2034
2TID
TotalEnergies Capital International SA 1.66% 22-JUL-2026Yield to maturity
4.55%
Maturity date
Jul 22, 2026
See all TTE bonds
Curated watchlists where TTE is featured.

Big Oil: Integrated energy companies
10 No. of Symbols

Oil stocks: Liquid black gold
6 No. of Symbols
See all sparks
Frequently Asked Questions
The current price of TTE is 65.03 USD — it has increased by 2.46% in the past 24 hours. Watch TotalEnergies SE stock price performance more closely on the chart.
Depending on the exchange, the stock ticker may vary. For instance, on NYSE exchange TotalEnergies SE stocks are traded under the ticker TTE.
TTE stock has risen by 0.05% compared to the previous week, the month change is a 0.02% rise, over the last year TotalEnergies SE has showed a 19.36% increase.
We've gathered analysts' opinions on TotalEnergies SE future price: according to them, TTE price has a max estimate of 90.81 USD and a min estimate of 59.73 USD. Watch TTE chart and read a more detailed TotalEnergies SE stock forecast: see what analysts think of TotalEnergies SE and suggest that you do with its stocks.
TTE stock is 1.05% volatile and has beta coefficient of 0.76. Track TotalEnergies SE stock price on the chart and check out the list of the most volatile stocks — is TotalEnergies SE there?
Today TotalEnergies SE has the market capitalization of 140.22 B, it has decreased by −1.24% over the last week.
Yes, you can track TotalEnergies SE financials in yearly and quarterly reports right on TradingView.
TotalEnergies SE is going to release the next earnings report on Feb 11, 2026. Keep track of upcoming events with our Earnings Calendar.
TTE earnings for the last quarter are 1.77 USD per share, whereas the estimation was 1.79 USD resulting in a −1.02% surprise. The estimated earnings for the next quarter are 1.68 USD per share. See more details about TotalEnergies SE earnings.
TotalEnergies SE revenue for the last quarter amounts to 43.84 B USD, despite the estimated figure of 47.42 B USD. In the next quarter, revenue is expected to reach 31.43 B USD.
TTE net income for the last quarter is 3.70 B USD, while the quarter before that showed 2.79 B USD of net income which accounts for 32.54% change. Track more TotalEnergies SE financial stats to get the full picture.
TotalEnergies SE dividend yield was 6.03% in 2024, and payout ratio reached 50.79%. The year before the numbers were 4.89% and 36.79% correspondingly. See high-dividend stocks and find more opportunities for your portfolio.
As of Dec 18, 2025, the company has 102.89 K employees. See our rating of the largest employees — is TotalEnergies SE on this list?
EBITDA measures a company's operating performance, its growth signifies an improvement in the efficiency of a company. TotalEnergies SE EBITDA is 37.61 B USD, and current EBITDA margin is 18.96%. See more stats in TotalEnergies SE financial statements.
Like other stocks, TTE shares are traded on stock exchanges, e.g. Nasdaq, Nyse, Euronext, and the easiest way to buy them is through an online stock broker. To do this, you need to open an account and follow a broker's procedures, then start trading. You can trade TotalEnergies SE stock right from TradingView charts — choose your broker and connect to your account.
Investing in stocks requires a comprehensive research: you should carefully study all the available data, e.g. company's financials, related news, and its technical analysis. So TotalEnergies SE technincal analysis shows the buy rating today, and its 1 week rating is buy. Since market conditions are prone to changes, it's worth looking a bit further into the future — according to the 1 month rating TotalEnergies SE stock shows the buy signal. See more of TotalEnergies SE technicals for a more comprehensive analysis.
If you're still not sure, try looking for inspiration in our curated watchlists.
If you're still not sure, try looking for inspiration in our curated watchlists.