WIPRO | Gann Square of 9 – 45° Support Case Study | 28 Mar 2022This idea presents a historical intraday example of how the Gann Square of 9 can be used to identify logical support levels based on price–degree relationships.
On 28 March 2022, WIPRO Ltd initiated a downward move after forming its 0° reference point near ₹609.
📐 Gann Degree Structure
0° level:
Next report date
—
Report period
—
EPS estimate
—
Revenue estimate
—
0.15 USD
1.55 B USD
10.54 B USD
10.47 B
About Wipro Limited
Sector
Industry
CEO
Srinivas Pallia
Website
Headquarters
Bengaluru
Founded
1945
Identifiers
3
ISINUS97651M1099
Wipro Ltd. is a global information technology, consulting and outsourcing company, which engages in the development and integration of solutions. It operates through the following segments: Information Technology Services, India State Run Enterprise Services, and Information Technology Products. The Information Technology Services segment provides digital strategy advisory, customer-centric design, technology consulting, IT consulting, custom application design, development, re-engineering and maintenance, systems integration, package implementation, global infrastructure services, analytics services, business process services, research and development, and hardware and software design to enterprises worldwide. The Information Technology Products segment offers a range of third-party IT products. The company was founded on December 29, 1945 and is headquartered in Bengaluru, India.
Related stocks


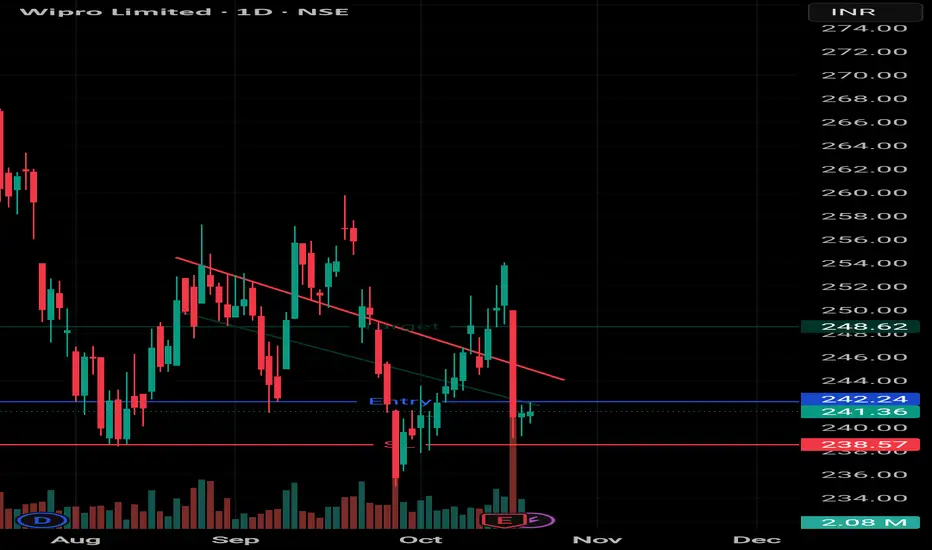
Wipro limited Buy 253-255
SL 250
Target 270-285
If you find this helpful and want more FREE forecasts in TradingView, Hit the 'BOOST' button
Drop some feedback in the comments below! (e.g., What did you find most useful?
How can we improve?)
Your support is appreciated!
Now, it's your turn!
Be sure to lea

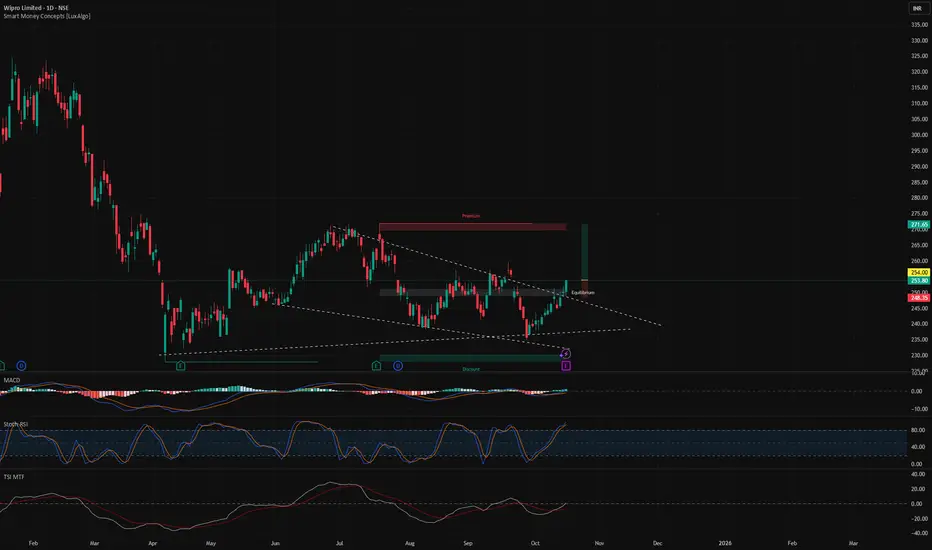
Wipro: Breakout & Boom!This is the daily timeframe chart of Wipro.
Wipro has been forming a falling wedge pattern, and the stock has given a breakout near the ₹250 level.
The breakout has also occurred above the long-term support zone of ₹225–₹240, which strengthens the bullish structure.
If this momentum continues, the


WIPRO FALLING WEDGE CHART PATTERN BREAKOUT [ BUY SIDE ]The latest price chart highlights a Falling Wedge pattern, a classic bullish formation that often signals the downtrend is losing strength and a breakout to the upside could be near. The stock has been consolidating within the wedge, and a breakout above the resistance line could confirm a strong up
Breakout in WIPROBreakout in WIPRO.
Entry - 254
Targets - 270, 285 & 310
SL - 248
DISCLAIMER: I am not SEBI registered and the ideas posted are only for educational purpose. Do a proper analysis and always trade with STOP LOSS.
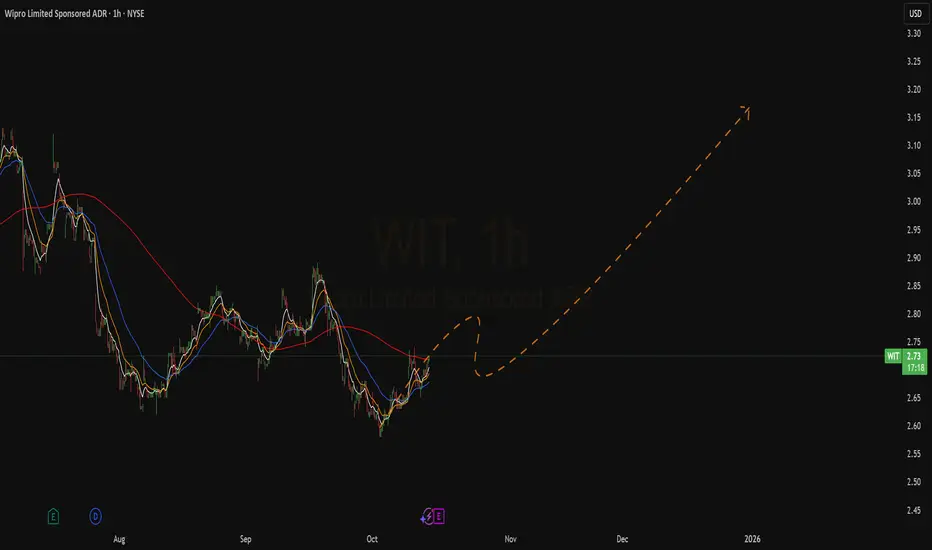
New Setup on $WITThe hourly chart sees a topSwing setup with a possible 10% move.
Bullish crossover with pullback and positive price action started.
Ready to catch it !
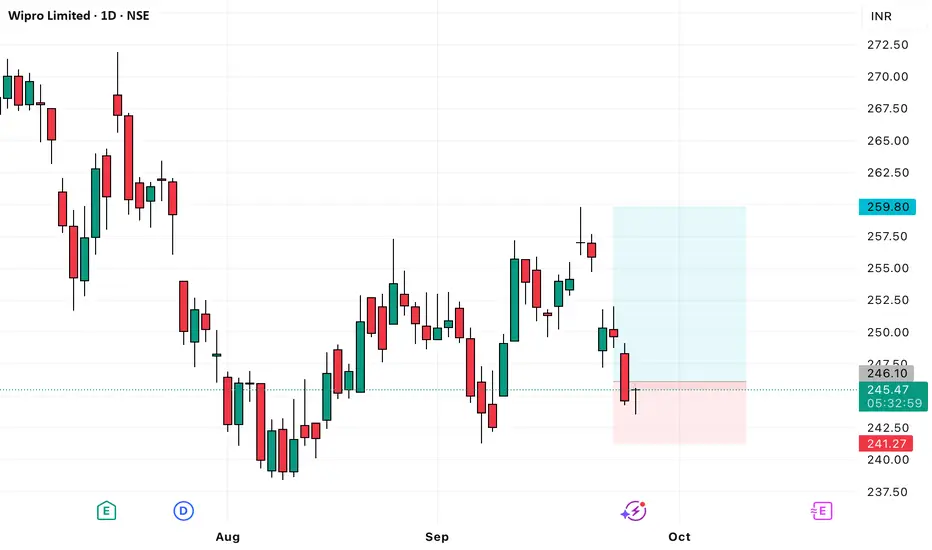
Wipro long setup looks good for 259Wipro looks good for 259
ENTRY - 244.36 to 246.1
Stop loss - 241.27
Target - 259.8
Risk Reward - 1:2.84
WIPRO @ 255: BIGGER PICTURE ANALYSIS 19-SEP-2025Supports: 228/177/77/14
Resistances: 328/373
As long as the above supports hold, we can see
Min. target: 327-355-407
461
Normal target: 519-550-634
Ultimate target: 712-746-782-834
Extension: 1125-1195

See all ideas
Summarizing what the indicators are suggesting.
Neutral
SellBuy
Strong sellStrong buy
Strong sellSellNeutralBuyStrong buy
Neutral
SellBuy
Strong sellStrong buy
Strong sellSellNeutralBuyStrong buy
Neutral
SellBuy
Strong sellStrong buy
Strong sellSellNeutralBuyStrong buy
An aggregate view of professional's ratings.
Neutral
SellBuy
Strong sellStrong buy
Strong sellSellNeutralBuyStrong buy
Neutral
SellBuy
Strong sellStrong buy
Strong sellSellNeutralBuyStrong buy
Neutral
SellBuy
Strong sellStrong buy
Strong sellSellNeutralBuyStrong buy
Displays a symbol's price movements over previous years to identify recurring trends.
Curated watchlists where WIT is featured.

Indian stocks: Racing ahead
46 No. of Symbols
See all sparks