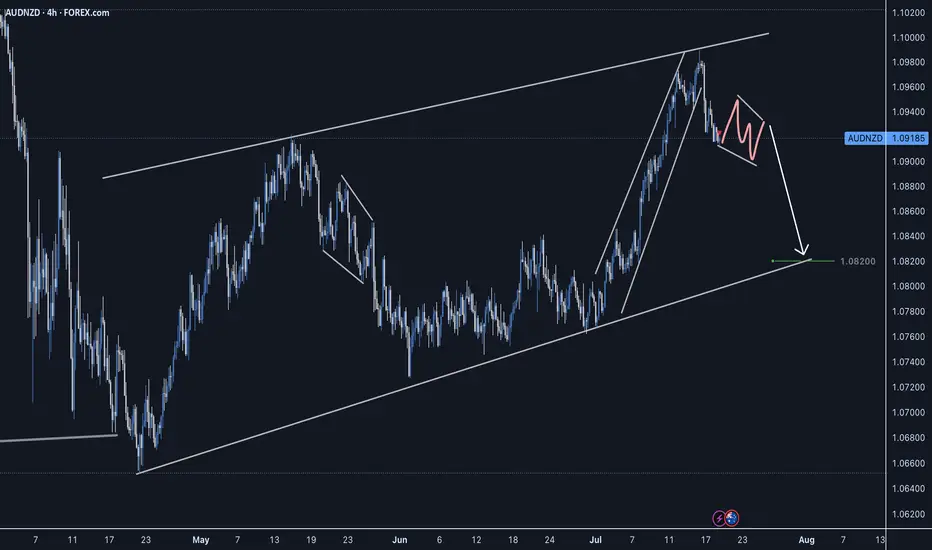
AUDNZD Short-sell IdeaAfter price made a BOS (Break of Structure), it entered a correction phase. Possibly we are looking at a short around the supply zone.
Related currencies

Audnzd buy Audnzd is looking rdy for recoil back north , current pullback is landing in a poi buy area, the current trend is up and we should be looking for potential buy signals around here . Stay vigilant here

AUDNZD: Ongoing Reversal from ResistanceI am watching for a reversal on AUDNZD as marked on my chart, expecting a reversal with a downside target at around 1.08700.
This is a high probability setup taken into account the overextended upside move to this resistance zone.
Just sharing my thoughts for the charts, this isn’t financial advi

AUD-NZD Local Long! Buy!
Hello,Traders!
AUD-NZD is about to retest
A strong horizontal support
Level of 1.0912 and as we are
Bullish biased we will be expecting
A local bullish rebound
Buy!
Comment and subscribe to help us grow!
Check out other forecasts below too!
Disclosure: I am part of Trade Nation's Influence

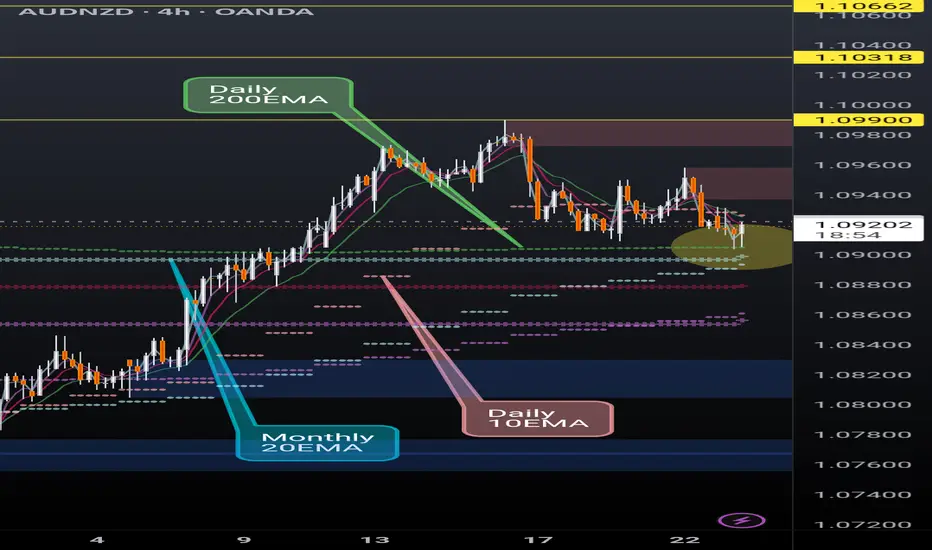
AUDNZD finding support on critical EMAsAUDNZD is finding support at the daily 200EMA (overlayed on 4H chart) and, more significantly, above the monthly 20EMA (overlayed). Break and hold the daily 10EMA (overlayed) will be key.
If the momentum continues we could see a continuation of the ongoing rally however recent AUD monetary policy m
AUD/NZDAccording to the COT report this pair is selling this week with a break of a support zone which is now a major resistance zone.
NZD/AUD We were at the bottom of a longer term ABC correction, so on the one-hour we waited for the impulse which we got around 7/16 and then the correction which ended on 7/22 at the trendline. Trade entered on 15 minute time frame, and it is timeto move the stop loss to break even.

AUDNZD: Bullish Move After Breakout📈AUDNZD has surpassed and closed above a key horizontal daily resistance level.
After retesting this broken structure, the price rebounded and broke above a resistance line of a falling wedge pattern, suggesting a strong likelihood of a bullish trend resumption.
The price is expected to reach th

AUDNZD Short Setup - CAB EntrySellers stepping in, strong reversal impulse. Waiting for a slight correction before taking a short entry on the LTF.
Good Luck
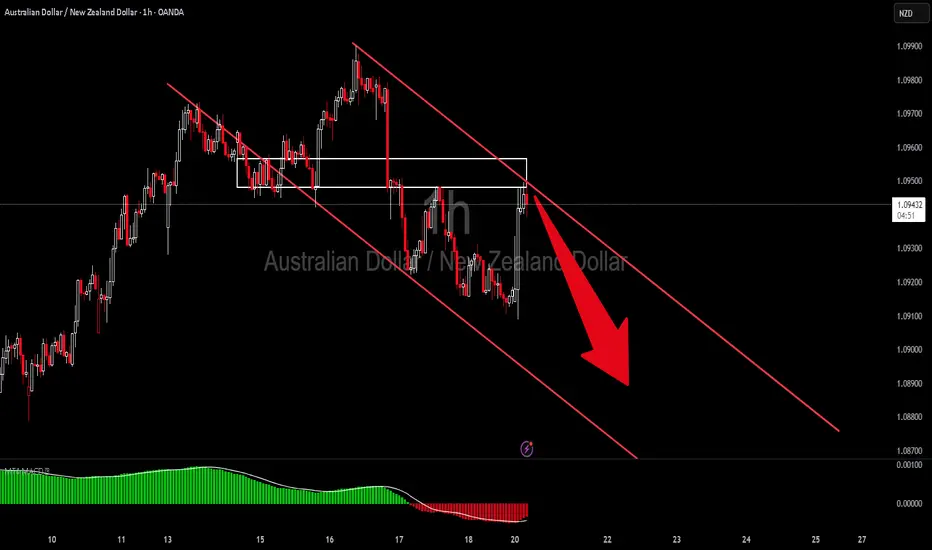
AUDNZD Channel Trading Scenario AUDNZD is Trading down trend and the Price rejected from he recent resistance trendline and is likely go down.

See all ideas
Summarizing what the indicators are suggesting.
Oscillators
Neutral
SellBuy
Strong sellStrong buy
Strong sellSellNeutralBuyStrong buy
Oscillators
Neutral
SellBuy
Strong sellStrong buy
Strong sellSellNeutralBuyStrong buy
Summary
Neutral
SellBuy
Strong sellStrong buy
Strong sellSellNeutralBuyStrong buy
Summary
Neutral
SellBuy
Strong sellStrong buy
Strong sellSellNeutralBuyStrong buy
Summary
Neutral
SellBuy
Strong sellStrong buy
Strong sellSellNeutralBuyStrong buy
Moving Averages
Neutral
SellBuy
Strong sellStrong buy
Strong sellSellNeutralBuyStrong buy
Moving Averages
Neutral
SellBuy
Strong sellStrong buy
Strong sellSellNeutralBuyStrong buy
Displays a symbol's price movements over previous years to identify recurring trends.
Frequently Asked Questions
The current rate of NZDAUD is 0.9147 AUD — it has decreased by −0.14% in the past 24 hours. See more of NZDAUD rate dynamics on the detailed chart.
The value of the NZDAUD pair is quoted as 1 NZD per x AUD. For example, if the pair is trading at 1.50, it means it takes 1.5 AUD to buy 1 NZD.
The term volatility describes the risk related to the changes in an asset's value. NZDAUD has the volatility rating of 0.16%. Track all currencies' changes with our live Forex Heatmap and prepare for markets volatility.
The NZDAUD showed a 0.13% rise over the past week, the month change is a −1.07% fall, and over the last year it has increased by 1.64%. Track live rate changes on the NZDAUD chart.
Learn how you can make money on rate changes in numerous trading ideas created by our community.
Learn how you can make money on rate changes in numerous trading ideas created by our community.
NZDAUD is a minor currency pair, i.e. a popular pair that is not associated with USD. Such pairs are also called cross currency pairs.
Currencies are usually traded through forex brokers — choose the one that suits your needs and go ahead. You can trade NZDAUD right from TradingView charts — just log in to you broker account. Check out the list of our integrated brokers and find the best one for your needs and strategy.
When deciding to buy or sell currency one should keep in mind many factors including current geopolitical situation, interest rates, and other. But before plunging into a deep research, you can start with NZDAUD technical analysis. The technical rating for the pair is sell today, but don't forget that markets can be very unstable, so don't stop here. According to our 1 week rating the NZDAUD shows the sell signal, and 1 month rating is sell. See more of NZDAUD technicals for a more comprehensive analysis.