OMUSDT Forming Falling WedgeOMUSDT is forming a clear falling wedge pattern, a classic bullish reversal signal that often indicates an upcoming breakout. The price has been consolidating within a narrowing range, suggesting that selling pressure is weakening while buyers are beginning to regain control. With consistent volume
Related pairs

$OM MANTRA coin analysis Hi 👋🏻 it's me your " Raj_crypt0 " ..... 💚
will BINANCE:OMUSDT next KRAKEN:LUNAUSD
" Yes , I hope so - 90% new High not possible
I hope it's not possible "
coin already got squeezed at $5/5.5 in weekly to 3 month time frame as weakness we can observe
Upcoming downtrend 📉 target 🎯 is -

Where Can We Rebuy OM? (1W)After the heavy drop, it became evident that a bearish trend had started, and the price is now seeking high-liquidity (buy) zones.
Based on the chart, the green zone stands out as the best area for a potential rebuy — it could launch the price upward by 100% to 500%.
Reaching this zone may take se

700% Potential: $OMUSDT at Key Support.The NASDAQ:OM chart shows price testing a key support zone around 0.2195, with a huge upside potential if it holds.
A 700% gain could be possible, targeting 1.6165.
Watch for confirmation above this level before jumping in.
DYOR, NFA


Approximately 92.6% decline OM Token 🚨 IMPORTANT RISK AND LIABILITY DISCLAIMER:
Attention: This analysis is solely a prediction and does not constitute any form of financial advice. Trading in financial markets carries a high level of risk and may lead to the loss of your capital. Before making any financial decisions, consult with a

OM RT-TOOL 3.0 UPDATEOM is trading in a massive area of support and offers a easy invalidation of minus 3.5%
RT-Tool 3.0 not only tells you when to buy but ALSO when ABSOLUTELY NOT to buy. We dont trade in betweent the context pulls! only when double red or blue is touched.

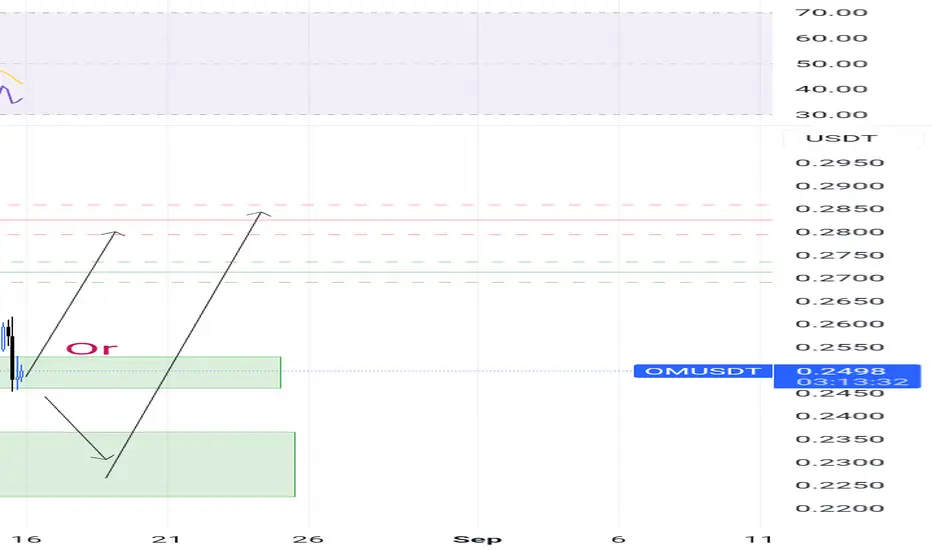
OMUSDTLets join us!
2 strategy can happen!
Both of them will rich .2800 or more...
Candle stick pattern in daily will happen tomorrow and it will grow!😁
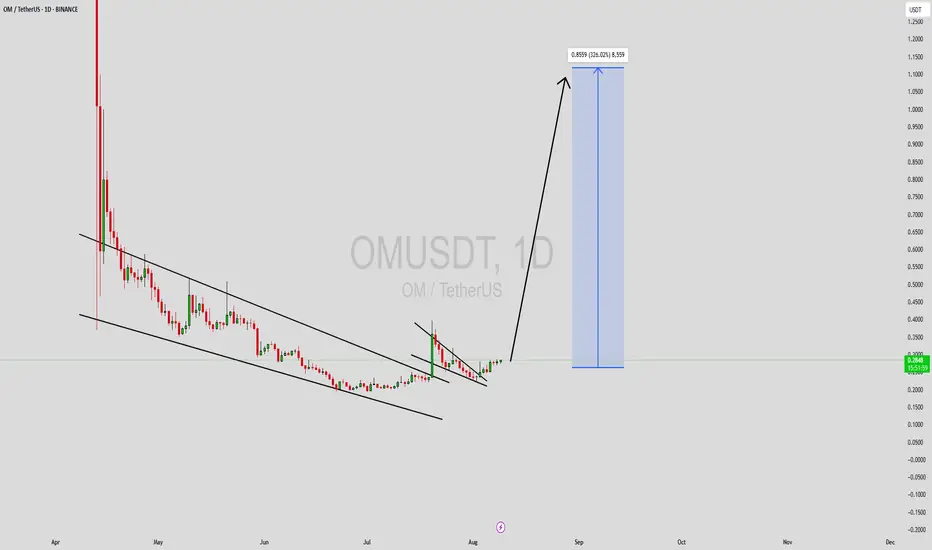
OMUSDT Forming Descending ChannelOMUSDT (OM / TetherUS) is currently showing a textbook descending channel breakout on the daily chart. After a steep downtrend, price has formed a tightening channel and is now pushing upward—signalling a potential major reversal. The breakout is supported by solid volume, suggesting accumulation an
OM big long to $0.3572Just now opened a long position on OM. Aiming for $0.3572 however will scale out at least 50% at $0.32
Seems like correction is over and possibly market about to pump
Sl: 0.2645
Tps on chart

See all ideas
Summarizing what the indicators are suggesting.
Oscillators
Neutral
SellBuy
Strong sellStrong buy
Strong sellSellNeutralBuyStrong buy
Oscillators
Neutral
SellBuy
Strong sellStrong buy
Strong sellSellNeutralBuyStrong buy
Summary
Neutral
SellBuy
Strong sellStrong buy
Strong sellSellNeutralBuyStrong buy
Summary
Neutral
SellBuy
Strong sellStrong buy
Strong sellSellNeutralBuyStrong buy
Summary
Neutral
SellBuy
Strong sellStrong buy
Strong sellSellNeutralBuyStrong buy
Moving Averages
Neutral
SellBuy
Strong sellStrong buy
Strong sellSellNeutralBuyStrong buy
Moving Averages
Neutral
SellBuy
Strong sellStrong buy
Strong sellSellNeutralBuyStrong buy
Displays a symbol's price movements over previous years to identify recurring trends.
Frequently Asked Questions
The current price of MANTRA/Tether (OM) is 0.07344 USDT — it has fallen −0.17% in the past 24 hours. Try placing this info into the context by checking out what coins are also gaining and losing at the moment and seeing OM price chart.
MANTRA/Tether price has risen by 9.04% over the last week, its month performance shows a −3.99% decrease, and as for the last year, MANTRA/Tether has decreased by −98.06%. See more dynamics on OM price chart.
Keep track of coins' changes with our Crypto Coins Heatmap.
Keep track of coins' changes with our Crypto Coins Heatmap.
MANTRA/Tether (OM) reached its highest price on Feb 23, 2025 — it amounted to 9.13300 USDT. Find more insights on the OM price chart.
See the list of crypto gainers and choose what best fits your strategy.
See the list of crypto gainers and choose what best fits your strategy.
MANTRA/Tether (OM) reached the lowest price of 0.01725 USDT on Oct 12, 2023. View more MANTRA/Tether dynamics on the price chart.
See the list of crypto losers to find unexpected opportunities.
See the list of crypto losers to find unexpected opportunities.
The safest choice when buying OM is to go to a well-known crypto exchange. Some of the popular names are Binance, Coinbase, Kraken. But you'll have to find a reliable broker and create an account first. You can trade OM right from TradingView charts — just choose a broker and connect to your account.
Crypto markets are famous for their volatility, so one should study all the available stats before adding crypto assets to their portfolio. Very often it's technical analysis that comes in handy. We prepared technical ratings for MANTRA/Tether (OM): today its technical analysis shows the sell signal, and according to the 1 week rating OM shows the sell signal. And you'd better dig deeper and study 1 month rating too — it's sell. Find inspiration in MANTRA/Tether trading ideas and keep track of what's moving crypto markets with our crypto news feed.
MANTRA/Tether (OM) is just as reliable as any other crypto asset — this corner of the world market is highly volatile. Today, for instance, MANTRA/Tether is estimated as 4.90% volatile. The only thing it means is that you must prepare and examine all available information before making a decision. And if you're not sure about MANTRA/Tether, you can find more inspiration in our curated watchlists.
You can discuss MANTRA/Tether (OM) with other users in our public chats, Minds or in the comments to Ideas.