ALTcoin Dominance Is On The Rise; ALTseason?BTC.dominance is coming down, while ALTcoin.dominance is on the rise, so ALTcoins could be doing better than Bitcoin in upcoming days/weeks, but for the real ALTseason, we need Crypto TOTAL market cap chart back to bullish mode.
OTHERS.D chart - ALTcoin dominance is breaking channel resistance line, so some ALTcoins are already nicely recovering, although Bitcoin is still searching for support.
As you can see, even OTHERS Crypto TOTAL market cap chart, which excludes top10 cryptocurrencies, is looking for a continuation higher after the recent complex w-x-y correction.
So, if it manages to break back above channel resistance line near 260B area, then ALTseason could be here, especially if Bitcoin starts recovering as well.
Trade ideas

Altcoins Market capAltseason haven't broken the 2021 highs yet this cycle.
Hold your bags until it breaks the 2021 highs. Altseason is coming


Global Long Imbalance — Structural UpdateYesterday I posted an idea describing a rare long-side imbalance detected by Long Zigg , where the 10% depth reached its maximum value of 100 several times over the past days.
This update focuses on what changed since then and how the current structure looks on the hourly chart.
Recent observations
On the chart I’ve marked all recent moments where Long Zigg = 100 .
Despite the continued price decline, the structural picture remains the same:
– The 10% depth is printing 100 again
– Limit order structure is still tilted toward buyers
– Price continues to move lower while the imbalance remains extreme
In other words, the market is showing a combination of falling price and a maximum long imbalance.
What this may indicate
Such setups often appear during periods of spot accumulation, where passive buyers continue absorbing sell pressure despite short-term declines.
This does not imply an immediate reversal, but for now the structure resembles accumulation, not panic distribution.

A NEW YEARS GIFT! CHEAP SHITCOINS!OTHERS Index
Has a Clear head and Shoulders
That could see an acceleration and further deterioration of #Altcoins
With major Capitulation's possible
protocol's could suffer hacks, exploits and rugs
Be careful of leveraged positions
And be aware of the risks of certain #defi platforms.
#sol
#sui
#ada
#eth
#bnb
#pulsechain
#btc

The Great Rising WedgeAltcoin market structure mirrors a macro rising wedge; the same bearish pattern that preceded the 2022 crash. A weak recovery after a sharp selloff, now forming on a higher timeframe, signals distribution before collapse.
Technicals align with macro risk:
• U.S. debt > $35T, credit cards and real estate at record highs.
• Berkshire Hathaway sits on $350B in cash.
• Michael Burry holds $1.1B in AI-related puts.
• Open interest and leverage across markets are extreme.
This setup reflects late-cycle euphoria; similar to 1999 (dot com) and 2008 (housing). The wedge is not just a chart pattern; it’s a symptom of systemic exhaustion.
If history rhymes, we’re nearing a global liquidity event where “blood in the streets” becomes reality again.

$OTHERS (WEEKLY): massive macro HEAD & SHOULDERSThis WEEKLY CRYPTOCAP:OTHERS chart — the most important MACRO chart for your shitcoins — so you’d better have a solid grasp of what’s happening here.
Why is it so key?
It’s the cleanest gauge of real altcoin strength because it filters out CRYPTOCAP:BTC and CRYPTOCAP:ETH dominance, highlights capital rotation phases, and exposes when liquidity genuinely returns to mid- and low-caps.
And now it’s flashing a massive BEARISH pattern — a 2-year-long Head & Shoulders, covering most of the current cycle, with price action sitting right on crucial levels.
Notice the similarity between this current H&S and the one we had between 2021 and mid-2022 (during the previous alt bull market). Both had a clean DEAD CAT bounce before losing the 50 MA (yellow line), which rolled over after the breakdown in both cases.
The horizontal support at $235B is identical to the 2022 level — and losing it back then led to absolute bloodshed across alts.
This #Alts index market cap now sits around $231.7B, and I’m expecting a dip to retest the neckline next — in confluence with the 200 MA (green line).
So, $204B is the ULTIMATE SUPPORT — it must hold. If it doesn’t, a flash crash to $159B looks highly likely.
That said, the 200 MA could trigger a relief rally, just like it did in 2022 — so I’m ready for that scenario as well.
👽💙
#others

Expansion phase to start in coming weeks /MonthsThe suppression has been done.
Biggest liquidation in history has been done.
Expansion phase should start in Altcoins in coming months 🤞

Altseason? Not yet — but the real move is coming... soon.As shown in the chart, the weekly MACD reset isn’t complete yet. A similar setup happened in September 2024 — we got a fake pump that fooled many, while the real breakout started in December 2024.
🔍 Why does this happen?
Impatient whales — often close to the “crypto president” — start buying early. Using influencers and media hype, they push the "New ATH" narrative and lure in retail. But this early FOMO creates a massive bearish divergence — the RSI hasn’t reset yet, and the market isn't ready.
📉 The result?
A painful 6-month correction that punishes impatience. The market always reverts to math — and math doesn’t lie.
You can’t fake momentum forever — no matter how much money you throw at it.
💡 My forecast remains unchanged:
Once the MACD weekly crossover happens, the real pump begins — no ETF, no Saylor needed. The market moves on its own, as it always has.
📊 Check the chart. Read the signals. Trust the data.
#Bitcoin #BTC #CryptoTrading #CryptoWhales #MACD #TechnicalAnalysis #BearishDivergence #Altseason #DYOR

ALTS Season is coming Hello, I hope you are all well
Today I'm going to share this idea with you. This chart shows the liquidity of altcoins below the top 10
I expect to see an upward trend from these areas and targets, as depicted in the chart.
Don't forget to manage your risk. This is not investment advice. Altcoins are highly risky, and you could lose all your money
Good luck to everyone 🤍

Key days are coming for crypto, and a dip seems likely soon.Hey everyone,
It’s been a rough and stressful period in crypto lately—especially for altcoins. But based on multiple indicators and market seasonality, it looks like we’re getting close to the bottom. Either the dip already happened, or we may see one final shakeout this week.
My expectation is that the market starts recovering by next week, and in the second half of the month we could see some big upside moves.
This is just my opinion, not financial advice — always DYOR.
Remember that I'm a spot position owner in altcoins mainly.
Cheers!

Let it continue.Positive news.
OTHERS remained above the 50 line on the RSI.
Volatility is increasing, judging by the SQZMOM.

Are alt season dreams about to become a nightmare? - Oct 21stThe term “alt season” refers roughly to the 10-month period that historically follows each Bitcoin halving, a window when capital rotation from Bitcoin into the broader crypto market drives explosive gains across alternative tokens.
The above 10 day chart shows the OTHERS market total (top 125 cryptos excluding BTC, ETH, XRP, and stable coins). Historically this 10-month phase has been a golden era for alt holders. But this time… something’s changed.
Back in June, I published “ Is Alt Season Dead? ”, the premise was simple: price action had already failed to respond in the first half of the window. Fast forward to October, and that thesis hasn’t just held, it’s been confirmed.
While influencers continue chanting “Get in before it’s too late!”, the chart says otherwise.
The facts are undeniable:
The 10-month window has closed , and altcoins failed to deliver.
Support has failed , price action has exited its ascending channel for the second time.
A bear flag has printed , projecting an additional $140 billion decline in total market cap, returning valuations back to early-2021 levels.
Let’s talk RSI
The RSI must close October above 45 (blue circles) to avoid confirmation of breakdown.
If that fails, expect the pattern that has defined every prior cycle: an 80% correction across the market total.
Look left. Each time RSI failed to hold this zone, the market total collapsed. And this time a collapse would revert to test the 2017 cycle top, a key structural backtest that historically marked capitulation.
In simple terms:
Above 45 → possible stabilisation
Below 45 → capitulation risk rises sharply.
What’s causing all this?
Two forces have combined to break the old altcoin model:
1. Token dilution
The flood of new tokens has fragmented liquidity beyond recognition. The market is now so diluted that true value plays are buried beneath layers of speculative noise. Most investors aren’t selecting projects, they’re using a "spray and pray" approach. This is unsustainable, and a grand flush-out is overdue.
2. Leverage dependence
At present, leveraged products account for nearly three times the capital entering spot markets. This imbalance has turned what used to be natural corrections into systemic liquidations. The $19 billion wipeout earlier this month wasn’t an accident, it was the inevitable result of excess leverage meeting low liquidity. Don't blame market manipulators, it was you.
Until that dynamic resets, alt season as we once knew it simply cannot exist.
Conclusions
The 2025 “alt season” wasn’t a bull run, it was a slow unwind disguised as optimism.
The data shows structural weakness, not strength.
If RSI fails to hold 45, history suggests another 70–80% drawdown across the alt market is not only possible but likely. This isn’t fear-mongering, it’s statistical repetition.
The dream of alt season has turned into the perfect trap.
And most are still cheering it on.
Ww
========================================
Disclaimer
This analysis is for educational purposes only and expresses personal opinion, not financial advice. Cryptocurrency markets are speculative and high-risk. Always perform your own research, understand your exposure, and base decisions on confirmation, not narrative.
Patience, risk control, and data (not hype) decide who survives the next cycle.

$OTHERSL a bullish signal is about to happen on 1WThis bullish signal has historically marked the start of every altseason, leading to a total altcoin market cap increase of at least 40% and up to 150% in previous cycles.
The signal appears on the RSI, one of the most reliable momentum indicators — and it may even invalidate the current bearish MACD scenario.
We could see a few months of moderate growth due to the divergence between the 1W MACD and RSI, but once these two indicators align in the same direction — boom! 🚀
Get ready, because the next altseason might already be forming on the chart — and if everything lines up, it could be massive.
📆 We'll know the answer by November.
#Altseason #CryptoMarket #RSI #MACD #Altcoins #CryptoTrading #TechnicalAnalysis #BullishSignal #AltcoinSeason #MarketAnalysis #CryptoInvesting

Others \ Altcoins Cycles 1st and 2nd... Channel movement starting from the bottom → Parabolic breakout.
Today? We're in the lower band of the 3rd cycle.
Momentum is at historic lows in HTF...
Expansion waves haven't even fully begun for Alts yet.

$OTHERS possible scenariosIt’s decision time for CRYPTOCAP:OTHERS , arguably the most accurate index to gauge the true altcoin market.
We’re now testing the $220 billion level, a critical support zone.
From here, two paths emerge:
either we bounce and start a meaningful trend reversal,
or we break down and revisit the wick from October 10, 2025.
Either way, altcoins may have to bleed a bit more before finding stability.
A massive head-and-shoulders pattern is clearly taking shape — and its theoretical target is near zero (no joke).
If this setup isn’t invalidated soon, we could be heading toward a major correction.
Let’s hope the $220B neckline holds strong.
If it fails, we might be watching the crypto equivalent of the dot-com crash — a potential black swan in the making.
Interestingly, the previous cycle also formed a similar head-and-shoulders pattern pointing to zero.
In reality, the downtrend bottomed out around $82 billion, not zero — so let’s hope history rhymes rather than repeats.
This time, the bad scenario suggests a bottom near $160 billion, which could mark the final stage of the altcoin bear market.
DYOR
#Altcoins #CryptoMarket #OTHERS #CryptoAnalysis #Bitcoin #Ethereum #CryptoCrash #HeadAndShoulders #MarketAnalysis #CryptoTrading #AltcoinSeason #TechnicalAnalysis #CryptoInvesting #BearMarket #CryptoNews #BTC #ETH #CryptoCycles #TradingView #MarketUpdate

Never alt season 2020 vs never alt season 2025Will this time be different or the same , MM will find the most painful path for the market to continue
is max pain on the up side or the down side. time will tell

Another March 2020 for altcoinsQuite bigger accumulation phase is happening as we speaking for Altcoins , specifically for those outside top 10 . You missed the black March ? God is giving you another chance .
There’s big money going around and volume increasing. I have another very similar chart to March 2020 which is for defi total and I will upload it next today .
Do not forget this are my own ideas . Dyor .

The Final Phase: End of the Cycle for Altcoin MarketThe market appears to be forming a rising wedge within a larger corrective Elliott Wave (A–B–C) structure. Wave (B) seems complete, and the current consolidation suggests exhaustion before a potential Wave (C) decline.
If the wedge breaks down, a strong selloff could follow — targeting the 50–80B zone, aligning with the 2020–2022 accumulation base. This scenario would represent a final capitulation phase before the next major cycle begins.

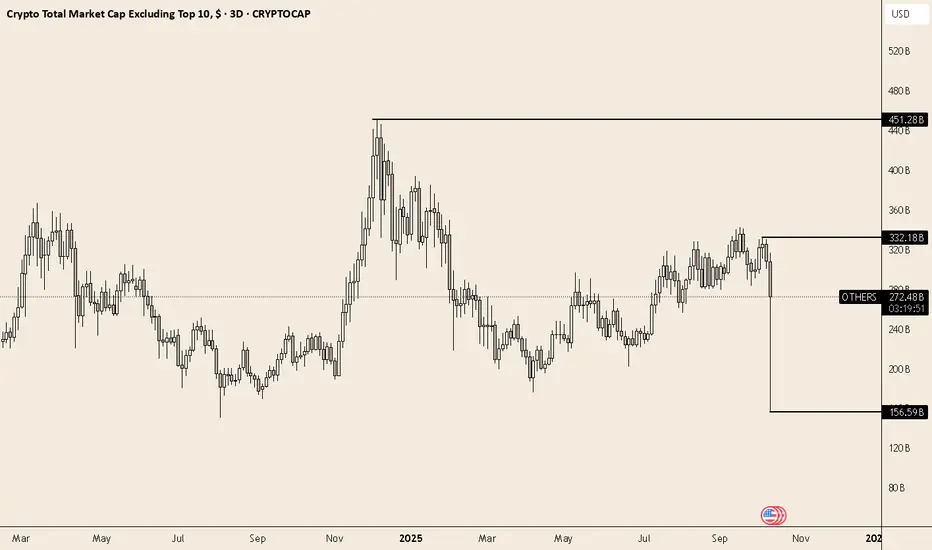
Altcoin Market Cap — A brutal crash and partial recoveryThe Total Crypto Market Cap excluding the Top 10 coins shows how extreme Friday’s move really was.
At the beginning of October, the “ CRYPTOCAP:OTHERS ” segment stood near $332B.
By the end of Friday’s crash, it had dropped to just $156B — a −53% drawdown in a matter of hours, wiping out months of speculative buildup.
Since then, the index has rebounded +73% from the lows, suggesting an aggressive short-covering rally rather than organic accumulation.
🔍 Key zones to watch:
$332B → prior range top / first resistance
$156B → capitulation low / liquidity sweep
The structure remains fragile — higher volatility and thin liquidity can amplify both sides of the move.
Until this chart rebuilds a base above $300B, altcoins remain in a vulnerable phase of the cycle.
Is Alt season dead? - June 2025Let me start by saying, Youtube influencers are lying to you. The collective narrative (from those links shared with me) talk almost exclusively about the same set of narratives for triggering “alt season”:
M2 money supply. The printer will be turned on any minute.
The FED is going to cut rates, the market will then explode.
Institutions are buying the dip! “Blackrock fills Ethereum long positions” etc
A dollar collapse.
The real season begins in 2026, stack now!
It is the same rubbish time and time again. Rarely will one of those influencers << Look left << to tell you the News as it is written on the chart.
Let me tell you the News…
The highly anticipated "alt season," where alternative cryptocurrencies (alt coins) significantly outperform Bitcoin, faces considerable challenges to deliver the much awaited “alt season” where everything blows up. However I’ve long argued those days are behind us, we’re not going to see an “alt season” again, at least not in the sense many understand the term "alt season".
Alt season refers mainly to those tokens that reside outside the top ten crypto tokens. The total market cap of this cohort outside the top 10 is referred to as INDEX:OTHERS total, as is shown in the main chart. Now I’ve long argued corrections for Ethereum to $700 and below, Litecoin to $20 and lower, generally legacy tokens should perform the worst during this bull market, that outlook does not change.
Why so pessimistic?
Headline 1 - Support and resistance
It is that simple. look left. Each alt season closed a monthly candle above the monthly 7 SMA and monthly 10 SMA (Green areas) before getting underway. Not only has this not happened during this bull market, support from the rising channel has failed and if the current monthly candle closes as it (in 7 days), then past support shall confirm as resistance. This would mean a collapse back to the 2017 market top of circa $50 billion.
Headline 2 - Bitcoin halving
The truth is “alt season” began in May 2024, that is if you’re a believer in the halving cycles. If you’re a believer then you must accept this bull market comes to an end in 90 days.
The orange vertical lines represent each Bitcoin halving, occurring in August 2016, June 2020, and lately May 2024. The so called “alt season” would follow the halving for a 518 day period. There is only 90 days left for alt tokens to do their stuff before this cycle comes to an end. However, influencers only seem to talk about how great 2026 is going to be and how now is the time to start stacking. Instead 2025 is really going to create a whole new number of bag holders of dead projects.
Headline 3 - The number of circulating tokens
In January 2017 there was 8885 tokens, the good ole days.
June 2020, still only 19,500 tokens
Fast forward to June 2025 and we have 17.45 million tokens. Utterly ridiculous.
The sheer proliferation of alt coins, now numbering in the millions, creates an overwhelming supply that far outstrips demand. This fragmentation of liquidity means that even when some tokens see brief pumps, it's often selective with only a handful of projects having strong narratives or specific utility that truly thrive.
The simple truth is the market must kill off millions of those dud projects to free liquidity to the few that matter. If you really must know where the money is going to come from that causes growth in the remaining winners, it is from the realisation that a number of those projects are dead. That includes projects such as Ethereum and Litecoin. Both those charts share an important distinction no one wants to talk or hear about.
There are projects out there that’ll buck the trend, do you know which ones they are?
Not everything will collapse to zero.
Ww


