Lingrid | PEPEUSDT Breakdown from Range May Spark SellingBINANCE:PEPEUSDT perfectly played out my previous trading idea . Price has lost its consolidation range and continues to print lower highs under a descending trendline, confirming bearish control. The breakdown below the range support signals trend continuation rather than exhaustion, with sellers defending every rebound attempt. Structure remains weak as price trades below former support, now acting as resistance.
If downside momentum persists, it could slide toward the next support band around 0.000032. Any bounce into the broken range or trendline is likely to attract fresh selling pressure.
➡️ Primary scenario: pullback → continuation lower toward 0.000032.
⚠️ Risk scenario: recovery back above 0.000040 would weaken the bearish setup.
If this idea resonates with you or you have your own opinion, traders, hit the comments. I’m excited to read your thoughts!
Market insights

PEPE — is it time to buy? Right now, in my view, it’s the best time for spot buying in the market. And one of the assets I’m actively accumulating is PEPE.
Why? Just a couple of months ago I wrote that it’s an outdated and useless asset, and now I’m buying it. How did that happen?
✅ The price is now at its lowest levels in a year and a half, near the strongest level — the listing price.
✅ I don’t believe we’re in some super-mega bear cycle and that crypto is going to die. From a technical point of view, Bitcoin hasn’t broken structure yet — what bear cycle are we talking about? Look at the Bitcoin chart: we’re still forming highs and lows, and we’re now in the process of forming a new low.
✅ Even if the price goes lower, it will never return to the 2023 lows and below. After each cycle, more liquidity stays in the market, and almost all assets finish the bear market at levels significantly higher than the previous bear market’s levels.
✅ RSI has reached near-record oversold levels, which historically — with a slight delay — has led to bounces.
✅ CMF shows liquidity outflows from the asset, but not as strong as the price is falling on the chart. Liquidity is leaving slowly, but for example, the liquidity reading is now at the same level it was in January 2025 when the price was 5x higher.
✅ Selling volumes are decreasing, seller pressure is weakening, and fewer people want to sell at current prices because the overwhelming majority are deep in the red.
✅ During the drop, a huge number of gaps were formed that continue to attract the price. As we know, in 99% of cases they get filled sooner or later.
During this drop, I personally am actively buying the market. The only people not buying now are those who believe crypto will literally die, because we haven’t seen prices like this in almost 2 years.
Are you buying or selling? ✍️

Pepe Gann Fann Bottom LevelDoing a quick up and down gann on Pepe shows us the best possible entry:
0.033 to 0.034 as a possible bottom not he weekly.
The move would then takes us to 1/1 of the red downward facing gann for next breakout and TP

PEPE Falling Wedge at Long-Term Support ZonePEPE is forming a clear falling wedge structure after a prolonged downtrend. Price action is compressing between converging downward trendlines, showing a slowdown in bearish momentum as sellers lose strength near the lower boundary.
The recent liquidity sweep below support followed by consolidation suggests potential base formation. If PEPE manages to break and hold above the upper boundary of the falling wedge, a relief rally toward the major descending resistance becomes likely. This would mark the first structural shift after an extended bearish phase.
On the downside, failure to defend the wedge base will invalidate the bullish reversal setup. In that scenario, price may continue lower toward deeper demand zones, keeping the broader downtrend intact.
This setup is driven by falling wedge dynamics, momentum compression, and liquidity behavior near higher timeframe support. Confirmation through breakout and acceptance is essential before expecting continuation.

PEPE Roadmap (3D)If we want to see what PEPE is doing on higher timeframes, we need to analyze it on larger timeframes.
It appears that Wave A of the new cycle will end within the green zone, and the price will enter a retracement for Wave B.
Wave B has two targets, which we have marked on the chart.
Let’s see what happens this movement will take time, as it is on the 3D timeframe.
For risk management, please don't forget stop loss and capital management
When we reach the first target, save some profit and then change the stop to entry
Comment if you have any questions
Thank You

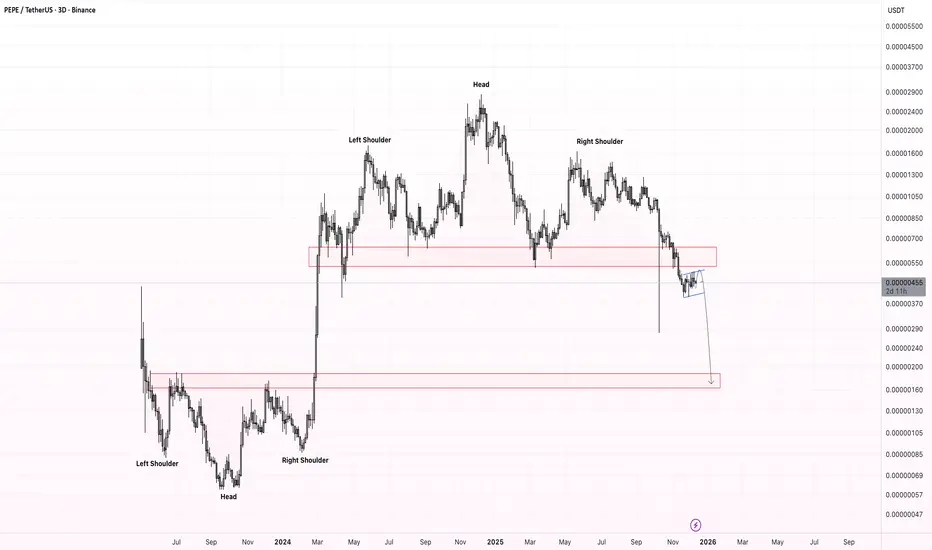
PEPE: Bearish Structure After Major Reversal PatternInitially, PEPE showed a powerful impulsive rally formed through an inverse Head and Shoulders reversal pattern. However, at the top a clear Head and Shoulders pattern has appeared, signaling a potential macro reversal.
Locally, the price is forming a bearish flag , which supports the continuation of the downtrend. Based on the current market structure, I do not recommend buying PEPE at these levels.
My expected downside target:
➡️ 0.000002 – 0.0000016 USDT zone
PEPEFull Elliott Wave cycle is completed on PEPE
But is it going to start a new one? For me is a question
Reversal and some bounce will happen for sure
Lets look how it will be structured
Probably I will like to see Wave 1 as Leading Diagonal

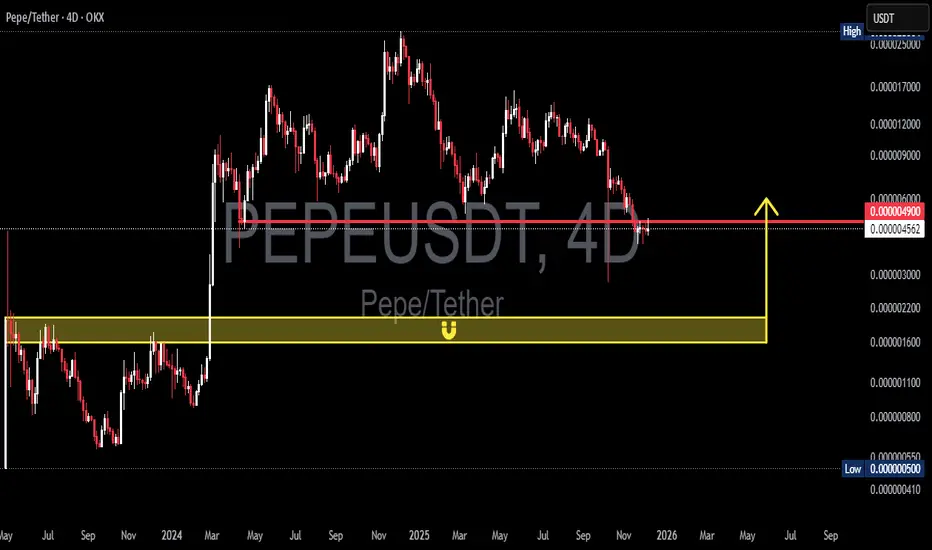
PEPE at a Critical Decision Point: Reversal or Deeper Breakdown?PEPE is approaching one of its most critical decision points since the major rally of 2024–2025. After forming a clean sequence of lower highs and sliding into a broader distribution phase, the market recently printed a deep liquidity sweep below local support — a signature move often associated with smart-money positioning.
Now the price is pulling back toward the 0.0000049 key resistance, a level that has historically acted as a battlefield between buyers and sellers. This level will decide whether PEPE regains momentum or continues its mid-term downtrend.
But the real story is below:
The yellow demand zone at 0.0000020 – 0.0000016 is the strongest structural support on the chart.
This area previously sparked a powerful upside reversal and will once again act as the final defensive wall if the market continues to drop.
---
✨ Bullish Scenario — The Reversal Signal Everyone Is Watching
A bullish reversal is not confirmed by a simple bounce.
It becomes valid only when PEPE can:
1. Close a 4D candle ABOVE 0.0000049
→ Indicates buyers taking structural control.
2. Retest the level successfully without breaking back below
→ Confirms the breakout is real and not a fakeout.
If these two conditions occur, the natural upside targets are:
0.0000060 (TP1) — minor supply
0.0000090 (TP2) — historical magnet
0.0000120 (TP3) — potential trend-shift zone
With proper volume, the structure can transition from bearish → neutral → bullish.
---
🔥 Bearish Scenario — Path Toward the Yellow Box
If the price gets rejected again at 0.0000049, bearish pressure remains dominant.
This opens two likely moves:
1. A controlled decline into the 0.0000020 – 0.0000016 demand zone
→ This zone is where large buyers typically step in.
2. A breakdown below 0.0000016
→ Signals a deeper structural flush
→ Indicates the market is cleaning liquidity before forming a new macro base.
In short:
0.0000020 – 0.0000016 is the battlefield that decides PEPE’s next major trend.
---
🎯 Pattern & Market Structure Insights
Well-defined downtrend with consistent lower highs
Clear liquidity sweep signaling institutional presence
Price currently trading between two extreme decision levels:
Key Resistance: 0.0000049
Major Demand: 0.0000020 – 0.0000016
This is a classic “decision point setup.”
The next move from here can define PEPE’s next multi-week or multi-month trend.
---
#PEPE #PEPEUSDT #CryptoAnalysis #MarketStructure #AltcoinAnalysis #DemandZone #LiquiditySweep #PriceAction #CryptoTA
PEPEUSDTWe are currently in a corrective phase after the latest bull trend. I believe the price is in the final steps of this downward correction, and if the market breaks above the 0.00000600 level, it could trigger a strong upward move in the next phase.
#pepe #pepeusdt CRYPTOCAP:PEPE KRAKEN:PEPEUSD BINANCE:PEPEUSDT

#PEPEUSDT: Big Move Is Coming, Comment Down Your ViewsI hope you are having a good weekend.
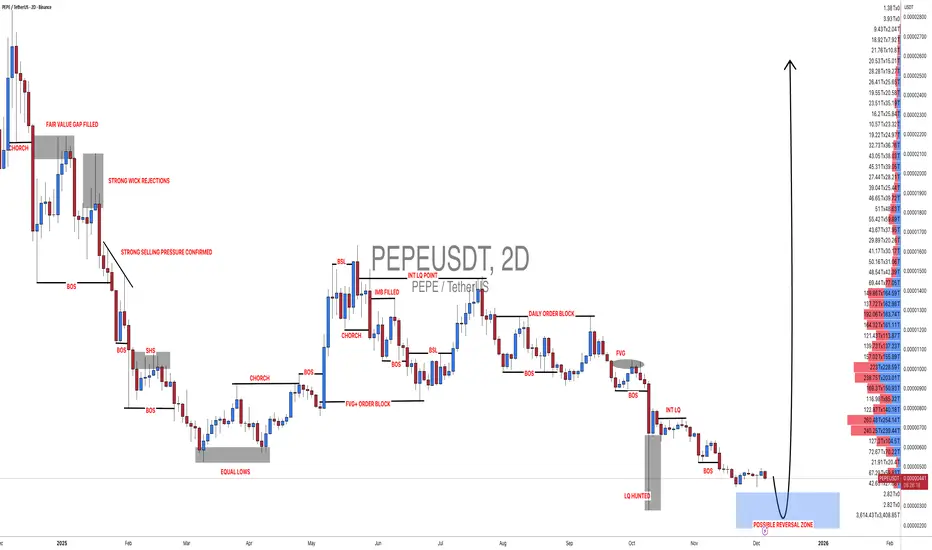
Let us focus on the current state of the cryptocurrency market. We have identified a key pattern in the BINANCE:PEPEUSDT which suggests a potential transition from an accumulation phase to a distribution phase.
We recommend waiting for price confirmation such as a break through the straight trend line and subsequent liquidity. Once this is confirmed, we suggest waiting for a price retracement and retesting the area which would serve as the second confirmation.
This is our analysis and not a guaranteed move. Please conduct your own research before making any changes.
Team Setupsfx_
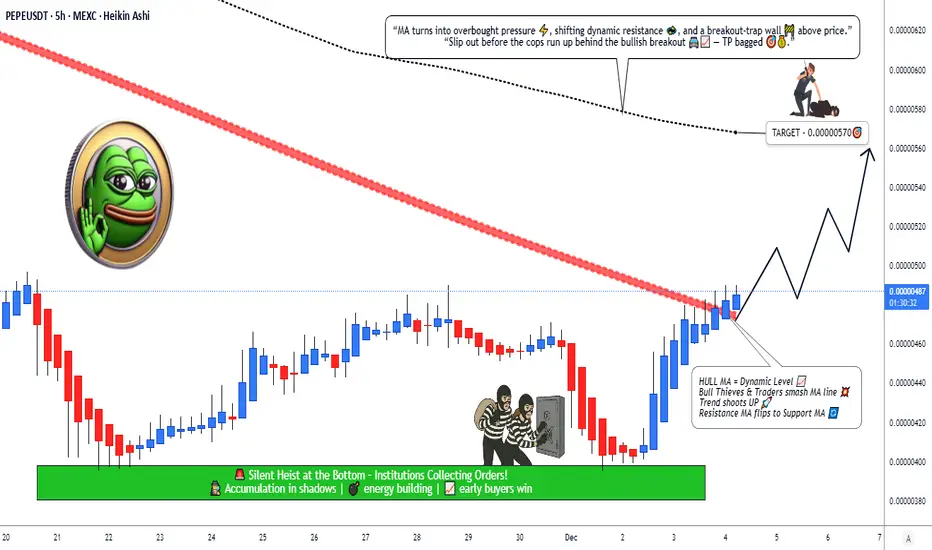
PEPE/USDT Trend Shift? Hull MA Break Signals Possible Upside🔥 PEPE/USDT – Hull Breakout Bullish Blueprint | Swing Trade Masterplan 🐸🚀
Asset: PEPE/USDT — “PEPE vs Tether”
Crypto Market Opportunity Blueprint (Swing Trade)
📈 PLAN — Bullish Plan confirmed with Hull Moving Average Breakout 💚⚡
Entry: YOU CAN ENTRY ANY PRICE LEVEL
Stop Loss: This is thief SL @ 0.00000440
Dear Ladies & Gentleman (Thief OG's) Adjust your SL based on your startergy & own risk.
PLACE SL AFTER THE BREAKOUT CONFIRMATION ONLY.
Note: Dear Ladies & Gentleman (Thief OG's) iam not recommended to set only my SL. its your own choice you can make money then take money at your own risk.
🎯 TARGET — Following SMA Resistance + Overbought Zone + Trap Alert ⚠️🔰
Simple Moving Average act as a strong resistance + overbought + trap is there
→ OUR target @ 0.00000570
Note: Dear Ladies & Gentleman (Thief OG's) iam not recommended to set only my TP. its your own choice you can make money then take money at your own risk.
📡 Related Pairs to Watch (Correlation + Key Points) 🔍📊
1️⃣ BINANCE:SHIBUSDT 🐕🔥
High correlation with meme-coin liquidity flows.
When SHIB pumps aggressively, PEPE usually follows due to risk-on behavior in the meme sector.
Watch for SHIB breakout above local resistance → signals strong liquidity returning to meme coins.
2️⃣ BINANCE:DOGEUSDT 🐶⚡
DOGE is the macro driver of meme-coin sentiment.
If DOGE shows HMA / SMA breakout, PEPE often mirrors with delayed volatility.
Large spikes in DOGE funding rates = PEPE momentum probability increases.
3️⃣ BINANCE:FLOKIUSDT 🐺💥
FLOKI often leads mid-cap meme rotation cycles.
When FLOKI rallies, PEPE tends to follow after short consolidation → swing traders use this correlation.
4️⃣ CRYPTO:WIFUSD (Solana Meme Leader) 🐕🦺🚀
A strong SOL ecosystem rally pulls meme funds from multiple exchanges.
PEPE benefits from cross-chain meme rotation once WIF volatility cools off.
5️⃣ BINANCE:BTCUSDT & BINANCE:ETHUSDT (Macro Drivers) 🧠📉📈
If BTC ranges & ETH strengthens → altcoins, esp. memes, get liquidity boost.
PEPE breakout success rate increases when:
BTC volatility is low
ETH shows positive funding rates
🧩 Summary for Traders (High Engagement Style)
PEPE preparing bullish continuation with Hull MA breakout 🔥
SMA resistance near target = take profits wisely
SL only after confirmation—Thief OG style 🕶️💼
Watch correlated meme-pairs for early signals
Liquidity rotation across SHIB → FLOKI → PEPE remains strong
PEPE Update🚨📊 PEPE Update
PEPE is testing the red resistance zone 🔴.
If breakout happens, first target = green line level 🟩🎯.

PEPEUSDT Forming Falling WedgePEPEUSDT is forming a clear falling wedge pattern, a classic bullish reversal signal that often indicates an upcoming breakout. The price has been consolidating within a narrowing range, suggesting that selling pressure is weakening while buyers are beginning to regain control. With consistent volume confirming accumulation at lower levels, the setup hints at a potential bullish breakout soon. The projected move could lead to an impressive gain of around 90% to 100% once the price breaks above the wedge resistance.
This falling wedge pattern is typically seen at the end of downtrends or corrective phases, and it represents a potential shift in market sentiment from bearish to bullish. Traders closely watching PEPEUSDT are noting the strengthening momentum as it nears a breakout zone. The good trading volume adds confidence to this pattern, showing that market participants are positioning early in anticipation of a reversal.
Investors’ growing interest in PEPEUSDT reflects rising confidence in the project’s long-term fundamentals and current technical strength. If the breakout confirms with sustained volume, this could mark the start of a fresh bullish leg. Traders might find this a valuable setup for medium-term gains, especially as the wedge pattern completes and buying momentum accelerates.
✅ Show your support by hitting the like button and
✅ Leaving a comment below! (What is your opinion about this Coin?)
Your feedback and engagement keep me inspired to share more insightful market analysis with you!
PEPEUSDT 12H#PEPE has broken above the descending resistance on the 12H timeframe chart. It is currently facing the 12H SMA50 and the Ichimoku cloud, and it seems to be pulling back to retest the broken trendline. It has also formed a double-bottom pattern. In case of a successful retest, the potential targets are:
🎯 $0.00000525
🎯 $0.00000602
🎯 $0.00000665
🎯 $0.00000728
🎯 $0.00000817
🎯 $0.00000931
⚠️ Always remember to use a tight stop-loss and maintain proper risk management.

PEPE Buy/Long Signal (2H)PEPE has reached a strong support zone at the bottom of the hourly timeframe.
After the first sweep, it moved downward again, collected liquidity, and then swept the key level.
We have marked two entry points on the chart, which are our intended entries.
We expect the upper liquidity pool to be taken out, or at least for the first target to be hit after the entries are triggered.
The targets are marked on the chart.
If the stop-loss is touched, this setup will be invalidated.
Do not enter the position without capital management and stop setting
Comment if you have any questions
thank you


PEPE/USDT : BUY LIMITHello friends
Well, you can see that after the price fell, it was able to rise by buyers. Now we have an important area where this resistance needs to be broken for the trend to change and the price to rise.
This analysis is purely technically reviewed and is not a buy or sell recommendation, so avoid emotional behavior.
*Trade safely with us*

PEPE/USDT : LIVE TRDEHello friends
Given the growth we had, the price has now formed lower floors and ceilings, which we have identified as sellers most likely pushing the price down.
Observe risk and capital management and avoid emotional behavior.
*Trade safely with us*

expect a continuation toward the next resistancePrice has reclaimed an important support level after forming a higher low structure, suggesting that bearish momentum is losing strength. Buyers are gradually stepping in, and the market is showing early signs of accumulation. As long as price holds above the reclaimed support zone, I expect a continuation toward the next resistance. My entry is based on the retest of this level, with a stop placed below the recent swing wick and a target toward the upper resistance area.

PEPE ($PEPE) Faces a Major Market Turning PointPEPE ( CRYPTOCAP:PEPE ) trades at $0.0447 after heavy weekly and monthly declines. Market sentiment across memecoins remains fragile, and PEPE now depends almost entirely on liquidity trends in Bitcoin and Ethereum. When the majors gain momentum, capital rotates into high-risk assets. When they stall, memecoins weaken. This dynamic shapes every PEPE cycle.
Launched in April 2023 with no roadmap or utility, PEPE remains driven purely by community strength, social buzz, and viral momentum. The formula has not changed: hype brings rallies, silence brings retracements. The community still influences every swing, and traders monitor whether new waves of attention can revive demand in a competitive memecoin landscape.
Market Drivers for PEPE in 2025
Two forces will determine whether PEPE stays relevant: memecoin sentiment and broader market conditions. If Bitcoin and Ethereum regain bullish structure, liquidity can quickly flow into PEPE. This effect has repeated in each cycle since the token’s launch. Social media hype adds fuel, especially during periods when traders chase volatility.
But competition grows. New memecoins appear daily, and capital rotates rapidly. Without fundamentals or utility, PEPE must rely on community engagement, visibility, and trader appetite for speculative moves.
Technical Outlook: Bears Still in Control
PEPE’s chart shows clear weakness. A confirmed head-and-shoulders structure points toward a target near $0.00000185, matching long-term accumulation zones identified by analysts. The crucial support at $0.0000059 broke and flipped into resistance, signaling continued bearish pressure until reclaimed.
Additional technical signals support this view:
Weekly imbalance partly filled
Multi-month liquidity swept
Lower-high structure intact
Support-to-resistance flip validates downside bias
A deeper drop of 60–70% remains possible if sellers maintain control. Yet long-term traders view this zone as an early accumulation area, similar to previous bottom formations that produced massive rallies. A decisive close above $0.0000059 would invalidate the bearish setup and signal a possible trend reversal.

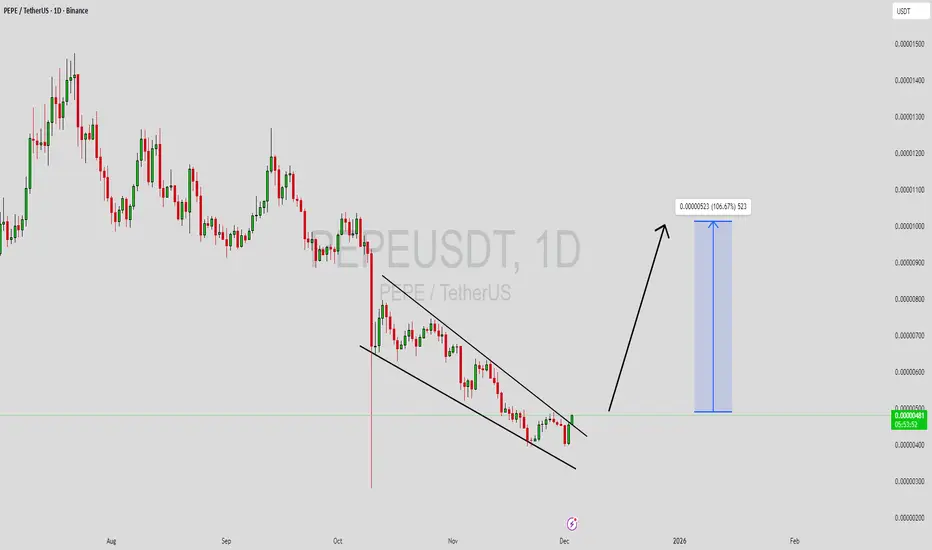
PEPE down but not out- Immense Gains on the horizonWell we are back in the season for PEPE. See my previous charts on the bull calls. At this stage we saw a huge sell off on Oct 10th as Trump declared 100% tariffs on China. But since then the price has recoil back into a very comfortable bottom range. The floor being 550 sats. From here we will continue to range, but this pattern also suggests that a violent up move will take place - once and maybe a retracement then another full move upside by winter 2025/ spring 2026.
Green arrow. There are other indicators that suggest the same but those wont be revealed. Given my track record with PEPE there is full confidence this is the bottom and that rapdi moves will be on the horizon.

PEPEUSDT is near major weekly support also trendline retest herePEPEUSDT appears to be concluding its bearish phase, with price action having breached a significant daily support level. The asset is now undergoing a critical retest of the broken trendline a common technical phenomenon where former Resistance(Red trendline) transforms into support . A successful rejection from this level could catalyze a robust bullish reversal. Based on the magnitude of the preceding decline and the strength of this support zone, we project a potential upward movement with an estimated appreciation target of 200% upon confirmed breakout confirmation.
DISCLAIMER: ((trade based on your own decision))
<<press like👍 if you enjoy💚

Haunt training levelsHello friends
We are back with another tutorial.
This time we are going to tell you a more advanced strategy.
Well, when a trend or structure forms, it doesn't matter whether it's bullish or bearish. In our example, it's an bullish structure. You should be careful that every structure eventually ends, and this ending has a series of signs. In this strategy, we'll teach you what those signs are and how to enter a trade and make a profit.
Well, as you can see, the buyers raised the price, and considering the higher ceilings and floors, we can tell that our structure is bullish and the buyers' hand is strong...
Here we are waiting for buyers to weaken, which is the important moment when, after hitting a ceiling, sellers push the price down, and you think that the structure has changed and enter a sell trade, placing your stop loss above the spike and waiting for the structure to change.
This is where the buyers come in and make their final move, hunting the previous high and your stop loss is triggered.
What to do now?
So, as we said, when you see the weakness of the structure, draw a resistance level like the level we have specified for you.
Now the price is falling from the ceiling and we are just waiting and when the price reaches the level again and cannot stabilize above our level and does not have the strength, so to speak, our level is hunted and the price falls, we do not expect to be able to enter the trade right there Because we need more confirmations.
So the price comes back and reaches our level, which we call a pullback. At this point, we must be very careful that the price weakens before our level or weakens at the level and cannot stabilize higher prices. This is where we enter the trade and our stop loss is placed exactly behind the hunted ceiling.
The target can also be the first price bottom and then, if the sellers are strong, lower bottoms...
Be careful that the win rate of this strategy is 70.
Be sure to observe risk and capital management.
*Trade safely with us*
