PHAUSDT 12H#PHA is moving inside a falling wedge pattern on the 12H timeframe. Volume has spiked, which is a positive sign. In case of a breakout above the wedge resistance and the 12H SMA50, the potential targets are:
🎯 $0.0537
🎯 $0.0628
🎯 $0.0702
🎯 $0.0776
🎯 $0.0881
🎯 $0.1014
⚠️ Always remember to use a ti

#PHA/USDT – Multi-Year Accumulation at a Critical Demand Zone!#PHA
The price is moving within an ascending channel on the 1-hour timeframe and is holding well. It is poised to break out strongly and retest the channel.
We have a downtrend line on the RSI indicator that is about to break and retest, which supports the upward move.
There is a key support zone

PHA/USDT – Multi-Year Accumulation at a Critical Demand Zone!
Overview:
PHA/USDT has been in a long downtrend since its 2021 peak. However, since mid-2022, price action has consistently formed a multi-year base around the 0.07 – 0.10 USDT demand zone (yellow box). This level has been tested several times, yet buyers continue to defend it, signaling strong acc
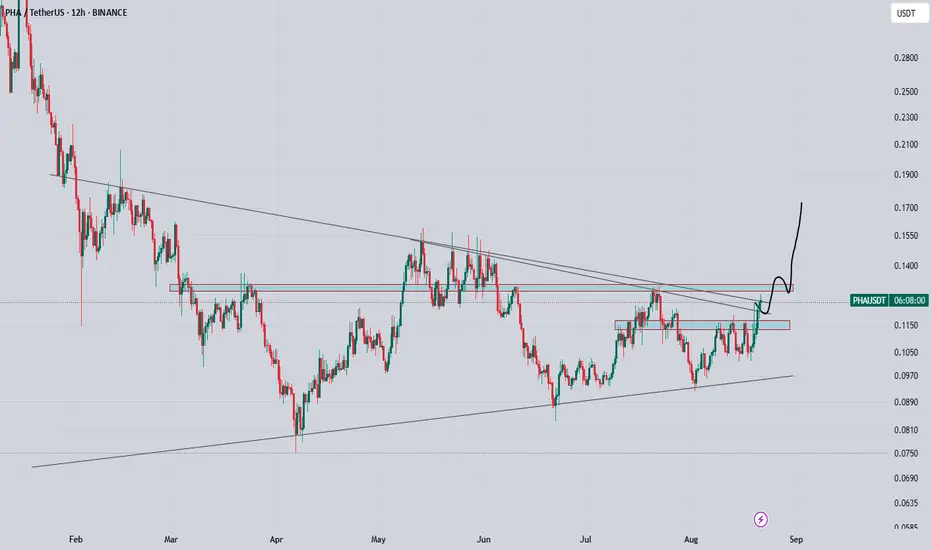
#PHAUSDT 4H ChartPrice had tapped perfectly into a 4h area of demand where it bounced from. MACD is showing bearish weakness and RSI is slightly sold. Price is expected to keep pushing up towards our minor supply zone at $0.108 as a short-term target.

#PHA - Price Analysis#PHA - Price Analysis
🔴 Still Bearish Beneath $0.1080–$0.1100 Resistance
🔸Structure: Bullish wedge forming 📈
🔸Daily Trend: Uptrend remains intact, continuing to support price 📈
Key Scenario:
If price continues to consolidate above $0.0980, I anticipate a potential strong move upward.
⚠️ Uncert

PHAUSDT 1D#PHA is moving within a symmetrical triangle on the daily chart and is currently facing the daily SMA100. A breakout above the SMA100 could signal further upside potential. If it breaks out above the triangle resistance, the targets are:
🎯 $0.1454
🎯 $0.1642
🎯 $0.1890
🎯 $0.2242
⚠️ As always, use a

Pha finally on verge of breakout consolidating within symmetrical triangle from long time, now trying to clear these multiple lines, as long as its holding 0.11 area. i will remain bullish and after breakout it can give solid rally, expecting 2x in coming days
Phala Network ~2,000% Uptrend Missing, Why?It is hard to believe that it has been four months already since we last updated this chart. This is PHAUSDT (Phala Network) and the last update happened 15-April 2025. Let me be clear and straight forward, market conditions are the same but better.
PHAUSDT continues to consolidate at bottom prices

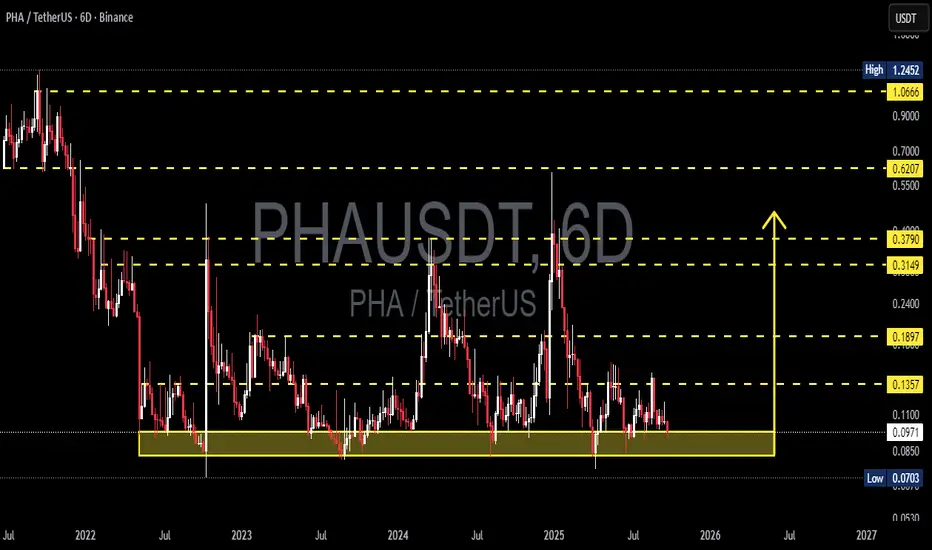
PHAUSDT at Make-or-Break Zone Is This the Calm Before the Storm?📍 Chart Overview (6D Timeframe – Binance)
PHA/USDT is currently retesting a major historical demand zone between $0.0703 - $0.0986, highlighted by the yellow box. This zone has acted as a strong base since mid-2022, repeatedly absorbing selling pressure and bouncing the price back up.
Over the pas

PHAUSDT 1D#PHA has formed a symmetrical triangle on the daily chart. It is currently trading above the Ichimoku Cloud and the daily SMA100, which is a strong bullish sign. In case of a breakout above the triangle resistance, the targets are:
🎯 $0.1454
🎯 $0.1642
🎯 $0.1890
🎯 $0.2242
⚠️ Always use a tight stop

See all ideas
Summarizing what the indicators are suggesting.
Oscillators
Neutral
SellBuy
Strong sellStrong buy
Strong sellSellNeutralBuyStrong buy
Oscillators
Neutral
SellBuy
Strong sellStrong buy
Strong sellSellNeutralBuyStrong buy
Summary
Neutral
SellBuy
Strong sellStrong buy
Strong sellSellNeutralBuyStrong buy
Summary
Neutral
SellBuy
Strong sellStrong buy
Strong sellSellNeutralBuyStrong buy
Summary
Neutral
SellBuy
Strong sellStrong buy
Strong sellSellNeutralBuyStrong buy
Moving Averages
Neutral
SellBuy
Strong sellStrong buy
Strong sellSellNeutralBuyStrong buy
Moving Averages
Neutral
SellBuy
Strong sellStrong buy
Strong sellSellNeutralBuyStrong buy
Displays a symbol's price movements over previous years to identify recurring trends.