#PHB/USDT is rejecting from the Diagonal Trendline#PHB
The price is moving within an ascending channel on the 1-hour timeframe and is adhering to it well. It is poised to break out strongly and retest the channel.
We have a downtrend line on the RSI indicator that is about to break and retest, which supports the upward move.
There is a key suppo

PHBPhoenix PHB, it is showing a good accumulation and strength, according to previous moves of this project, i would say that it will hit 1$
hope to have analyzed well and also the market will act as a booster..
NFA
DYOR

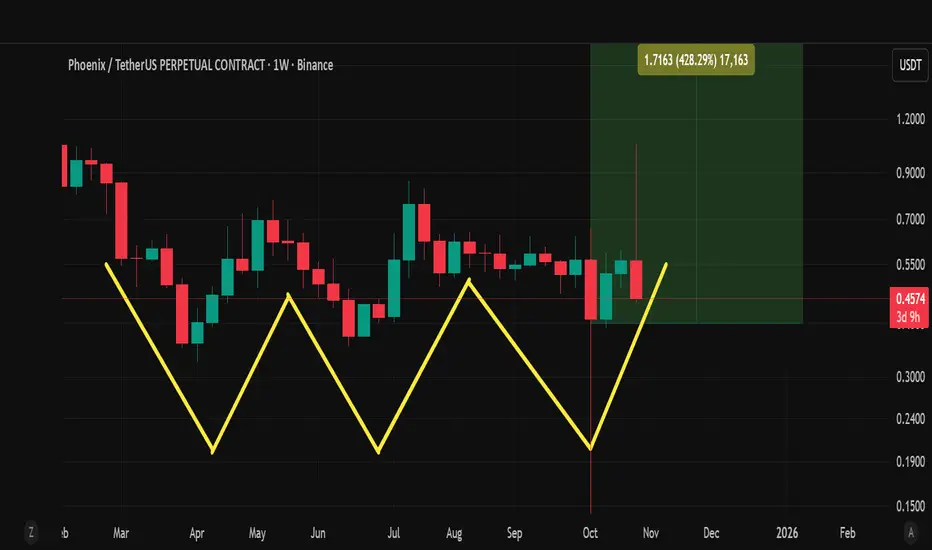
#PHB is ready to perform the Triple Bottom bullish formation#PHB is ready to perform the Triple Bottom bullish formation🕯
📌 Target Level
💵 $ 0.5275
💵 $ 0.7080
💵 $ 1.2350
💵 $ 1.916
#PHB/USDT#PHB
The price is moving within a descending channel on the 1-hour frame and is expected to break and continue upward.
We have a trend to stabilize above the 100 moving average once again.
We have a downtrend on the RSI indicator that supports the upward move with a breakout.
We have a support a

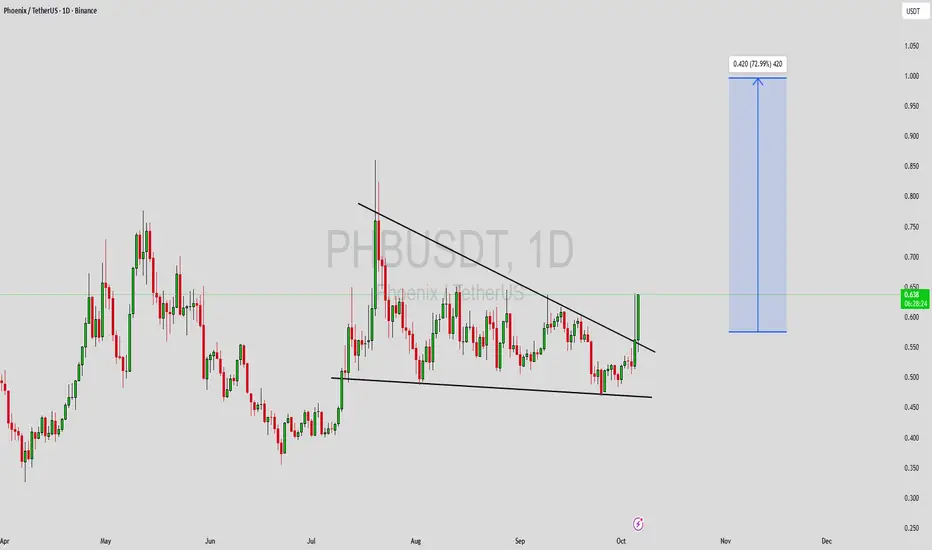
PHBUSDT 1D#PHB is moving inside a descending triangle pattern on the daily chart and has bounced off the triangle’s support line.
In case of a breakout above the daily SMA200 and the triangle resistance, the potential targets are:
🎯 $0.598
🎯 $0.747
🎯 $0.867
🎯 $0.987
🎯 $1.159
🎯 $1.377
⚠️ Always remember to u

The AI era begins!The project aims to combine AI, privacy, and Web3 technologies to build infrastructure & apps (dApps) that are fast, scalable, and privacy-preserving.

PHBUSDT Forming Falling WedgePHBUSDT is currently displaying a classic falling wedge pattern on the chart, a strong bullish signal that often indicates a trend reversal. After a prolonged consolidation phase within tightening support and resistance lines, the price seems to be preparing for a breakout to the upside. The good tr
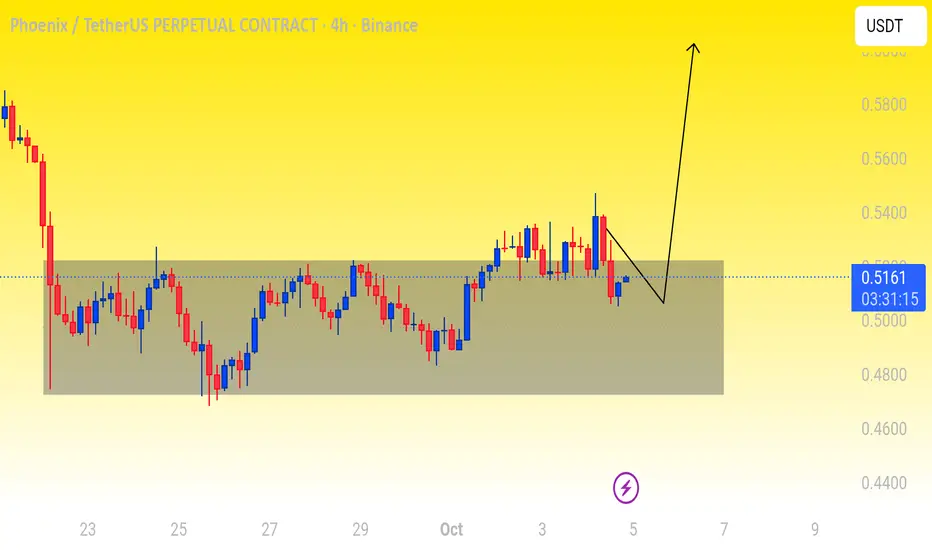
PHB PLAN AMEX:PHB Update 💹
Price is holding well within the buy zone around 0.53 – 0.52 and showing signs of strength. The overall structure looks bullish, and I’m expecting a move toward 0.56 – 0.65 in the coming sessions 🚀
Momentum is building, and the chart looks ready for the next leg up 📈
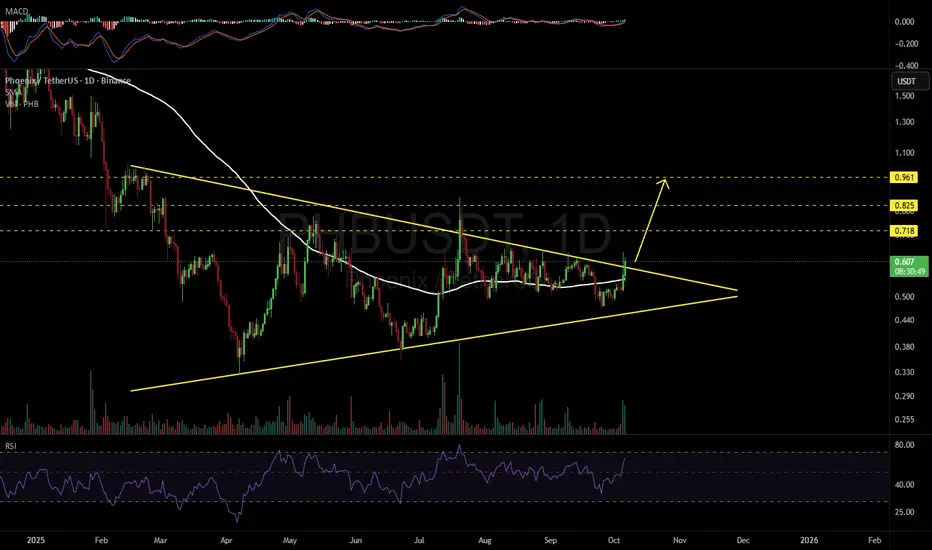
PHBUSDT 1D#PHB has broken above the symmetrical triangle resistance and the SMA100 on the daily chart. The increasing volume is a positive sign. If it manages to close the daily candle above the triangle, the potential targets are:
🎯 $0.718
🎯 $0.825
🎯 $0.961
⚠️ Always remember to use a tight stop-loss and m
PHBUSDT UPDATE#PHB
UPDATE
PHB Technical Setup
Pattern: Bullish falling wedge pattern
Current Price: $0.95
Target Price: $1.48
Target % Gain: 55.97%
AMEX:PHB is breaking out of a falling wedge pattern on the 1D timeframe. Current price is $0.95 with a target near $1.48, showing about 56% potential upside. The

See all ideas
Summarizing what the indicators are suggesting.
Oscillators
Neutral
SellBuy
Strong sellStrong buy
Strong sellSellNeutralBuyStrong buy
Oscillators
Neutral
SellBuy
Strong sellStrong buy
Strong sellSellNeutralBuyStrong buy
Summary
Neutral
SellBuy
Strong sellStrong buy
Strong sellSellNeutralBuyStrong buy
Summary
Neutral
SellBuy
Strong sellStrong buy
Strong sellSellNeutralBuyStrong buy
Summary
Neutral
SellBuy
Strong sellStrong buy
Strong sellSellNeutralBuyStrong buy
Moving Averages
Neutral
SellBuy
Strong sellStrong buy
Strong sellSellNeutralBuyStrong buy
Moving Averages
Neutral
SellBuy
Strong sellStrong buy
Strong sellSellNeutralBuyStrong buy
Displays a symbol's price movements over previous years to identify recurring trends.