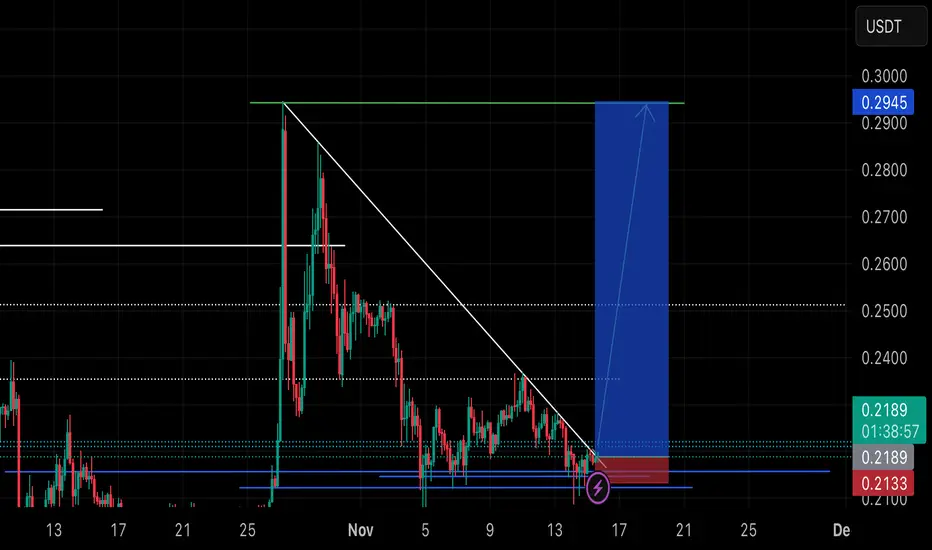
Pi (+)If this cryptocurrency, which has been in a medium-term downtrend, breaks and moves above the green cloud (Kumo), a sharp rally will definitely occur.

Pi Network (PI) Update - Lower Coming? Pi Network is showing weakening momentum as bullish volume fades around the $0.22 point of control, opening the probability of a deeper sweep of liquidity below current levels.
Sellers are gaining traction, and a test of the $0.20 value area low is becoming increasingly likely unless buyers step in

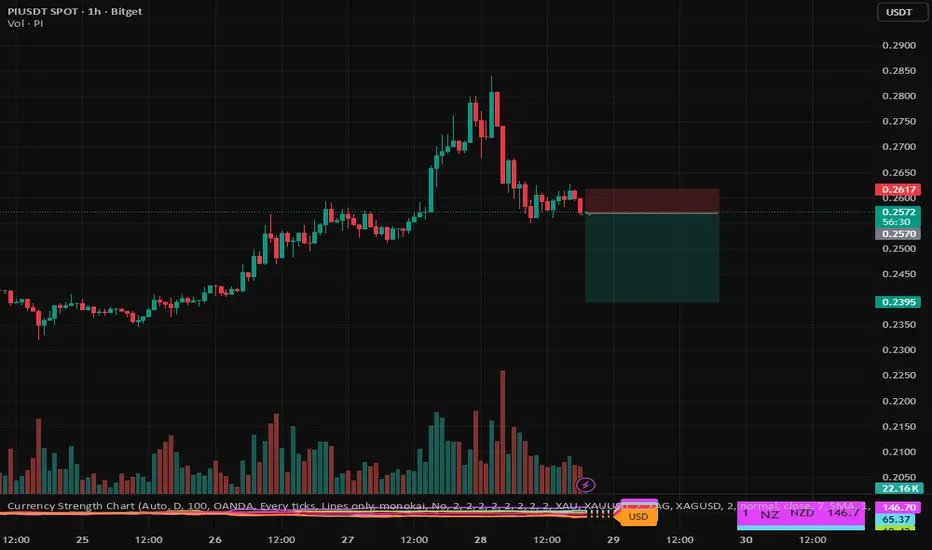
PI Update🚨📊 PI Update
PI has also formed a new resistance zone in red 🔴.
This level is now acting as a strong ceiling,
and price must break out above this red resistance
to show any real bullish momentum again.
Until that breakout happens,
sellers remain in control and upside stays limited.

PI is pulling back into a short-term support areaThe recent rejection from the upper zone created a corrective structure, and price is now retesting the previous demand region. If this area fails to hold, a deeper correction toward the next liquidity zone is likely. The stop-loss is placed above the recent consolidation, targeting a continuation m
PI Update🚨📊 PI Update
We have a strong resistance zone in red 🔴 on PI.
Previously, price tried to break this level and failed,
showing how important this zone is.
Now the price is approaching this resistance again,
and there is a possible breakout this time
if buyers show enough strength to push above it.
T

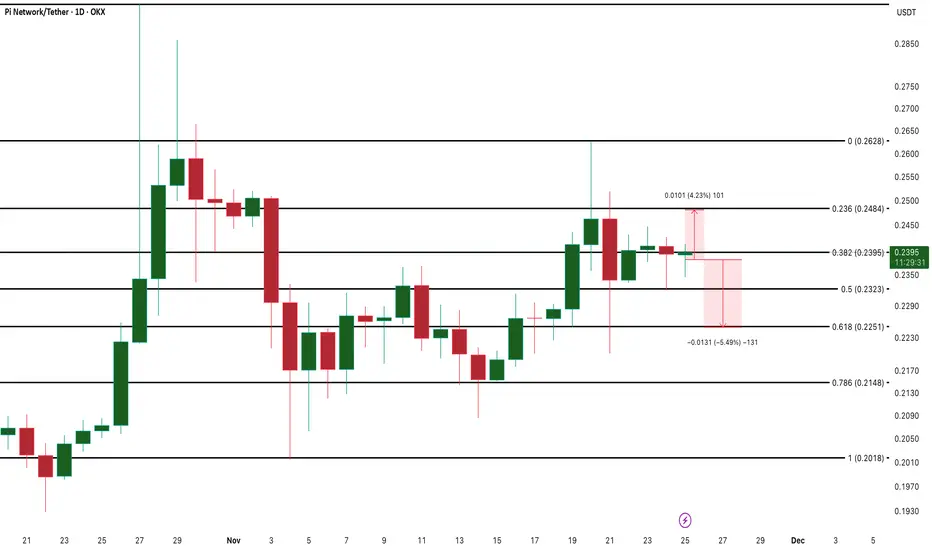
PI Breakout Needs $0.24 While $0.22 Still Threatens a DropOKX:PIUSDT trades inside a very tight band, with price stuck between $0.24 and $0.22 since mid-November. The range is narrow enough that even a small move can decide the next trend. A close above $0.24 turns the recovery into a proper rally toward $0.26 and $0.29, but a slip below $0.22 exposes $0.
Pi Network (PI) Update — Adam & Eve Pattern FormingPi Network is developing a rare Adam and Eve bullish reversal pattern, with price holding firmly above the Point of Control. This behaviour signals early accumulation and improving sentiment at current levels.
As PI pushes toward the neckline between $0.21 and $0.28, the rounded bottom structure co

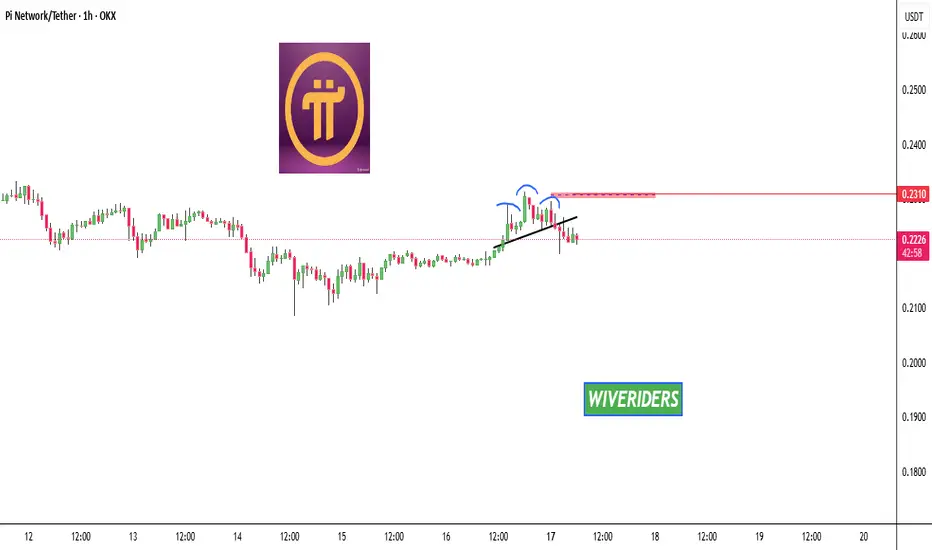
PI Update🚨📊 PI Update
PI has formed a bearish head and shoulders pattern,
and the price is dropping as expected from this structure.
What we want to see now is the price coming back up
and testing the red resistance zone 🔴.
If NASDAQ:PI manages to break out above this red resistance,
it could signal tha
$PIUSDT Look promising if .2515 is broken Pi has been fluctuating around .2081 - .2195 and it’s looking bullish.
Anticipated next stop .315
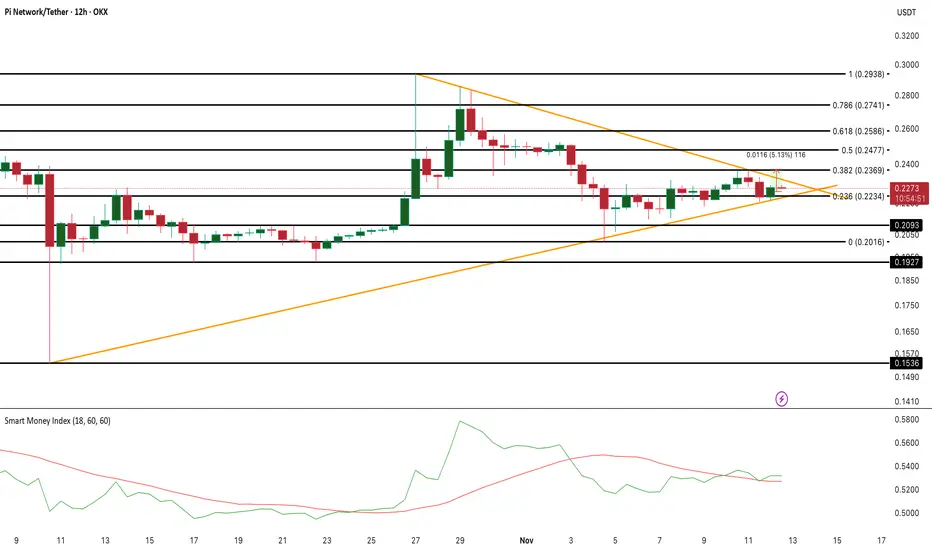
Smart Money Eyes Pi Coin Breakout; OBV, MACD Signal ShiftPi Coin’s price is pressing against the upper line of a symmetrical triangle, signaling a possible breakout attempt. The squeeze shows a tug between short-term sellers and early buyers trying to regain control.
On the 12-hour chart, the Smart Money Index (SMI) has turned up for the first time since
See all ideas
Summarizing what the indicators are suggesting.
Oscillators
Neutral
SellBuy
Strong sellStrong buy
Strong sellSellNeutralBuyStrong buy
Oscillators
Neutral
SellBuy
Strong sellStrong buy
Strong sellSellNeutralBuyStrong buy
Summary
Neutral
SellBuy
Strong sellStrong buy
Strong sellSellNeutralBuyStrong buy
Summary
Neutral
SellBuy
Strong sellStrong buy
Strong sellSellNeutralBuyStrong buy
Summary
Neutral
SellBuy
Strong sellStrong buy
Strong sellSellNeutralBuyStrong buy
Moving Averages
Neutral
SellBuy
Strong sellStrong buy
Strong sellSellNeutralBuyStrong buy
Moving Averages
Neutral
SellBuy
Strong sellStrong buy
Strong sellSellNeutralBuyStrong buy