Polygon (POL): Looking For Proper Market Structure Break HerePOL is sitting right on its local bottom, and this zone has reacted well before. For now we want to see some kind of shift in momentum here — a small reversal structure or MSB forming before even thinking about entering. If buyers manage to defend this area and show proper strength, we’ll be looking at a long setup with a solid upside range to target. But if this level fails, we stay patient and avoid forcing anything.
Swallow Academy
Trade ideas

TradeCityPro | POL Near Key Trigger in Ongoing Downtrend👋 Welcome to TradeCity Pro!
In this analysis, I’ll review POL, one of Ethereum’s Layer-2 ecosystem projects, currently ranked 52nd on CoinMarketCap with a market cap of $1.41 billion.
⏳ 4-Hour Timeframe
POL is currently in a downtrend on the 4-hour timeframe and is now moving inside a corrective range within that trend.
🔔 This downtrend continued until the 0.1311 support zone, and after reaching this level, the price began a corrective move upward, retracing up to 0.1391.
📊 Throughout this correction, volume has been decreasing, which is expected and also confirms that sellers still have control of the overall trend.
✨ Given the bearish trend and volume confirmation, opening a short position remains the more logical strategy for now.
💥 On the RSI, we have a support level at 39.60.
A break below this level would be the first sign of a new bearish wave beginning.
📉 The main short trigger on POL is 0.1311.
If this trigger breaks with increasing volume, the downtrend can easily continue.
🧩 For long positions, it’s too early, the market needs to show a clear trend reversal first.
To confirm a reversal, the price must stabilize above 0.1391 and form a higher high and higher low above this zone.
⭐ However, if buying volume begins to increase inside the current range and bullish candles become stronger than the bearish ones, the chances of a trend reversal rise — and in that scenario, a break of 0.1391 can act as an early long trigger.
📝 Final Thoughts
Stay calm, trade wisely, and let's capture the market's best opportunities!
This analysis reflects our opinions and is not financial advice.
Share your thoughts in the comments, and don’t forget to share this analysis with your friends! ❤️


POL/USDT — Long Setup🟩 Entry Zone: 0.1653$ - 0.16400$
🎯 Targets:
1️⃣ 0.1710
2️⃣ 0.1810
3️⃣ 0.1900
4️⃣ 0.2100+
🔻 Stop-Loss: Below 0.150

POLPSX:POL looks like a good entry in my opinion. I recently listened to an X Spaces with the CEO, and he sounded focused and committed. The chart is trading in a horizontal channel that’s formed a nice descending wedge pattern, signaling an upcoming uptrend in price soon.

TradeCityPro | POL Faces Crucial Resistance Test👋 Welcome to TradeCity Pro!
In this analysis, I’m going to review POL, one of Ethereum’s Layer 2 projects, currently ranked #48 on CoinMarketCap with a market capitalization of $1.87 billion.
⌛️ 4-Hour Timeframe
On the 4-hour chart, after finding support around 0.1590, this coin formed a high at 0.1724 and has since made its first bullish move after breaking that level.
✔️ Right now, price is facing resistance around 0.1836, a zone it has already tested twice—each time getting rejected.
✨ If 0.1836 breaks, we can look for a long position, with the next resistance area sitting around 0.2046.
📊 یFor short positions, I’ll wait until the structure turns bearish before acting. At the moment, the short trigger is at 0.1724, but the main confirmation of a downtrend would only come after a break below 0.1590.
📝 Final Thoughts
Stay calm, trade wisely, and let's capture the market's best opportunities!
This analysis reflects our opinions and is not financial advice.
Share your thoughts in the comments, and don’t forget to share this analysis with your friends! ❤️

Polygon (POL): Expecting To See $0.28 | Bullish POL made a quick liquidity grab and bounced straight back from the zone that’s been acting as support before. Looks like buyers are trying to turn it around here.
What we want to see now is a clean reclaim of the EMAs — that would confirm the turnover and open the way for a recovery leg. Till then, we wait for confirmation.
Swallow Academy

Pol next big move to 0.24$ means 24% gain Hi
the support and resistances on the chart are based on the previous data and weekly candlesticks if BINANCE:POLUSDT holds this last support the potential of 24% gain is logical toward 0.24$

POLPSX:POL is still trading within a horizontal channel, showing clean price action with buyers defending support and sellers reacting at resistance. Once it breaks out of this range, the move could offer a potential 100% profit from current levels. Accumulation looks healthy.

POL/USDT — Final Accumulation Before the Breakout?POL/USDT is currently playing with fire inside the key zone 0.195–0.175 (yellow block) — an area that has repeatedly acted as a major demand base since mid-year.
The price structure is forming an ascending base pattern, where each dip creates a higher low — signaling that buyers are quietly building strength beneath the surface.
This zone could be the final accumulation phase before a breakout, or the last trap before a deeper breakdown.
---
Pattern Explanation
Yellow Block (0.195–0.175) → Major demand zone where buyers have consistently defended price.
Ascending Support Line → Indicates a bullish continuation base, suggesting steady buying pressure.
Layered Resistances:
R1: 0.2127
R2: 0.2410
R3: 0.2847
R4: 0.3226
Sideways Range on Support → Market is coiling within a tight range; the longer the base, the stronger the potential breakout.
---
Bullish Scenario
Confirmation Signal: A 2D candle close above 0.2127 with strong volume and body expansion.
Strategy:
Aggressive entry: accumulate near the lower zone (0.195–0.180) on rejection wicks.
Conservative entry: wait for breakout confirmation above 0.2127.
Target levels:
→ 0.2410 (minor take-profit)
→ 0.2847 (psychological barrier)
→ 0.3226 (main target zone).
Stop-loss: Below 0.175 for protection.
Bullish Narrative:
If confirmed, this structure transforms into a reversal pattern, potentially leading to a 60%+ upside over the next few weeks.
---
Bearish Scenario
Confirmation Signal: A 2D candle close below 0.175 and breakdown of the ascending trendline.
Strategy:
Breakdown confirms bearish continuation; target 0.125–0.115 as the next major demand zone.
Short entry after a failed retest around 0.175–0.195.
Stop-loss above 0.205.
Bearish Narrative:
Losing this block would invalidate the bullish structure and confirm a continuation of the downtrend.
---
Technical Summary
The chart is in a make-or-break zone:
Hold the base → potential accumulation breakout pattern.
Lose the base → continuation of the bearish leg.
This quiet phase often signals that smart money is positioning ahead of a big move — the breakout direction will determine the next multi-week trend.
---
#POL #POLUSDT #CryptoAnalysis #TechnicalAnalysis #SupportResistance #Accumulation #BreakoutWatch #PriceAction #SwingTrade #CryptoSetup #Trendline #MarketStructure

Polygon (POL): Expecting Good Bounce Very Soon | BullishPOL looks excellent, where recently the price has been showing some positive bullish signs. POL remains a promising sleeper coin that holds potential for significant gains.
More in-depth info is in the video—enjoy!
Swallow Academy

POL/USDT – Knocking on the Door of Breakout TerritoryHey there! I'm back on track again :-)
Date: September 2, 2025
POL has been quietly coiling for months, and now it’s pressing right against a key resistance wall. The setup is starting to look like the calm before the storm.
🔍 Technical Snapshot:
Current Price: $0.286
EMA Levels:
4EMA: $0.256
50EMA: $0.238
100EMA: $0.220
200EMA: $0.225
👉 Price is finally trading above all major EMAs for the first time in a while — a textbook early signal of a trend reversal.
📊 Chart Structure & Price Action:
For months, POL has been trapped under the $0.28–0.29 resistance zone.
Each dip has been shallower, forming a staircase of higher lows — a sign of buyers building pressure.
Today’s candle is poking above resistance, showing the market is testing supply.
📉 Supports to Watch:
$0.256 (4EMA, immediate support)
$0.238 (50EMA support)
$0.22 (100/200EMA cluster – strong demand zone)
📈 Targets if Breakout Confirms:
First stop: $0.3915
Next supply zone: $0.4752
Major extension target: $0.5610
📊 Volume & Momentum:
Volume spike today suggests smart money participation.
RSI is trending bullish, but not yet overbought — leaving room for expansion.
🎯 Creative Bullish Outlook:
Think of POL like a spring being compressed for months under that $0.29 lid. Each push lower was weaker than the last, while buyers kept showing up. Now, with volume flowing in, that lid might finally pop.
If price clears $0.29 convincingly, it could ignite a chain reaction of stops and fresh entries, fueling a run toward $0.39 and beyond.
📉 Invalidation:
A rejection and drop back under $0.238 would put the breakout thesis on hold.
Losing $0.22 would flip the chart bearish again.
⚡ Summary:
POL is at a make-or-break level. A confirmed breakout above $0.29 could kickstart a multi-stage rally, targeting $0.39 → $0.47 → $0.56.

POLUSDT: Trend in daily timeframeThe color levels are very accurate levels of support and resistance in different time frames, and we have to wait for their reaction in these areas.
So, Please pay special attention to the very accurate trend, colored levels, and you must know that SETUP is very sensitive.
Be careful
BEST
MT

Polygon (POL): Looking For Bounce Inside Bullish ChannelPOL continues to respect the ascending channel perfectly despite that smaller accumulation area below the lower side of the channel (support). Each touch on the lower trendline attracts strong buying pressure and that's what we are looking for.
As long as the channel holds, we can expect continuation toward the upper boundary of the range. Patience will pay off if buyers maintain this momentum.
Swallow Academy

POLPSX:POL is currently trading within an ascending channel nested inside a broader horizontal accumulation range, a strong structural setup indicating steady demand. The first target lies at the upper boundary of the horizontal channel. Once that level is tapped, I’ll reassess the structure and provide updated targets accordingly.

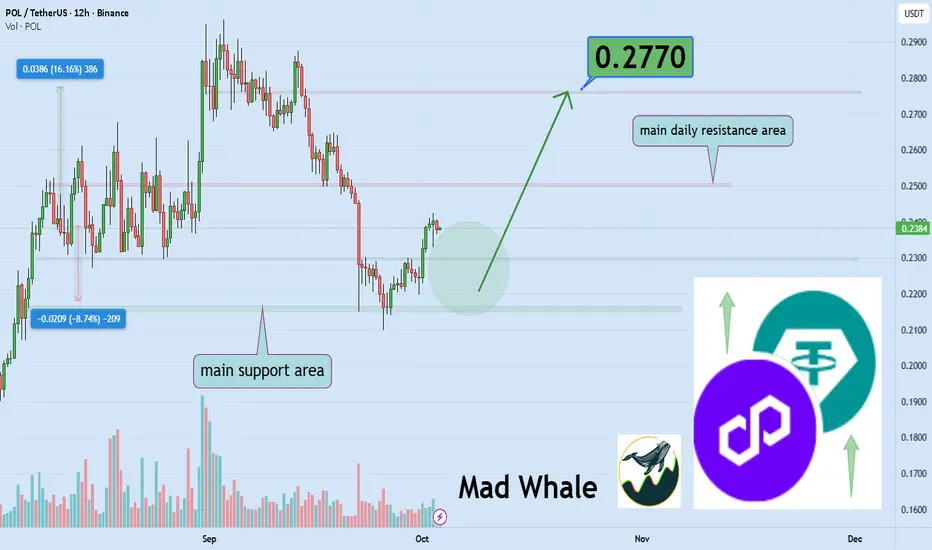
Polygon Poised To Rally 16% Toward $0.2770 TargetHello✌️
Let’s analyze Polygon’s price action both technically and fundamentally 📈.
🔍Fundamental analysis:
Polygon (POL) is upgrading to process more transactions faster and cheaper. Heimdall v2 already cut finality to ~5s, and the Rio upgrade targets 5,000 TPS. Past upgrades often pushed POL up 5–9% in a week.
📊Technical analysis:
BINANCE:POLUSDT is testing a crucial daily support; holding here could set up a potential 16% rally toward $0.2770.📈
📈Using My Analysis to Open Your Position:
You can use my fundamental and technical insights along with the chart. The red and green arrows on the left help you set entry, take-profit, and stop-loss levels, serving as clear signals for your trades.⚡️ Also, please review the TradingView disclaimer carefully.🛡
✨We put love into every post!
Your support inspires us 💛 Drop a comment we’d love to hear from you! Thanks, Mad Whale
Polygon (POL): Loading For Breakout | Good Momentum After 200EMAPolygon has formed a decent bullish trend here where price is looking for a potential breakout, which would give us a very good opportunity for a long position so that's what we are looking for.
A break of 200 EMA is where buyers should establish dominance and then lead the price to upper zones!
Swallow Academy

POL - Confluence at Demand: Longs on the Trendline?POL BINANCE:POLUSDT has been overall bullish on the daily, moving inside a rising channel. Price is sliding toward the demand zone at $0.19–$0.21, right where the channel’s lower trendline comes in, clean confluence for dip buyers.
This zone is key 🔑. If bulls defend it, I’ll look for a rotation toward $0.25, then $0.29–$0.31 near the channel mid/upper bounds 🚀.
If $0.19 fails on a daily close, I’ll step aside and reassess lower before looking for fresh confirmation.
What’s your move => bid the confluence at $0.19–$0.21, or wait for strength back above $0.25 first? 🤔
⚠️ Disclaimer: This is not financial advice. Always do your own research and manage risk properly.
📚 Stick to your trading plan regarding entries, risk, and management.
Good luck! 🍀
All Strategies Are Good; If Managed Properly!
~Richard Nasr

Polygon (POL): Reached Good Turning Point Before Pump | BullishPOL can give us a good turning point from here if buyers manage to get that market structure break on smaller timeframes.
More in-depth info is in the video—enjoy!
Swallow Academy

POL LONG IDEAim taking a long position here for BINANCE:POLUSDT.P
This is risky so I'm not responsible for your losses. DYR
Entry SL TP are visible on the chart.

POLUSDT Technical Analysis (2H Timeframe)Let’s see what opportunities the market might give us to enter! ⚡️
The price of POL has been in a steady downtrend after rejecting the 0.275–0.280 resistance zone. It is now approaching a strong demand zone around 0.238–0.245, where buyers have previously shown significant interest. The RSI is near the oversold area, indicating potential for a short-term relief bounce if buyers step in.
🔹 Key Support Zone: 0.238 – 0.245
🔹 Key Resistance Zone: 0.275 – 0.280
🔹 Likely Scenario: Further drop into the demand zone followed by a possible bullish reaction
⚠️ This analysis is for educational purposes only and should not be considered as financial advice. Always use proper risk management.
POL USDT LONG TRADE SETUPNew Trade Setup: POL-USDT
LONG
Entry: 0.2590 or CMP
Target: TP1: 0.2686, TP2: 0.2783, TP3: 0.2879, TP4: 0.2975
Stoploss: 0.2288
Leverage: 1X
Technical Analysis: POL/USDT is taking support from its support area there is high change of short term of trend reversal, we can see up trend in short term.

matic analysis chart for IRANIANHello dear people of Iran, all the details are clear in the film, and I said that because it is the first time, there are some shortcomings that you should forgive for your greatness. In short, watch it, enjoy it, like it, if you don't enjoy it, sacrifice your head.
