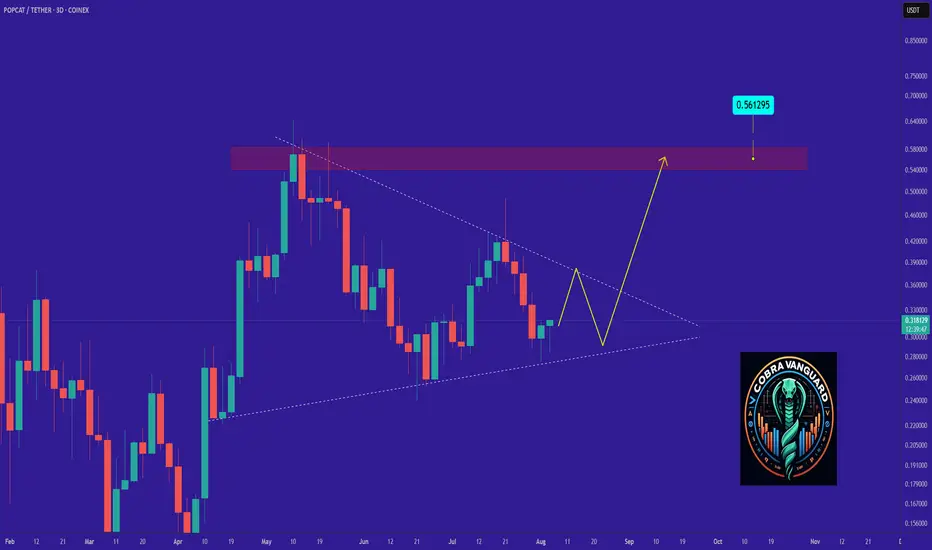
we shall see a good amount of increase in POPCAT price !It seems the price is forming a head and shoulders pattern, which, if correct, suggests a good price increase in the coming days. However, we should wait for the pattern to fully complete.
Best regards CobraVanguard.💚
Trade ideas

PopCat (POPCAT) Update — Downtrend Pressures Yearly LowPopCat has been in a persistent downtrend since April, with price now drifting toward the yearly low. This level is a weak low, and if it holds, a short-term rally toward the higher time-frame resistance at $0.13 may unfold.
However, the dynamic resistance overhead continues to cap upward movement. Until this trendline is broken, the bearish market structure remains dominant, and downside continuation is more likely.
Key Points
- Price approaching a weak yearly low on sustained downtrend
- Potential rally toward $0.13 if support holds
- Dynamic resistance still suppressing bullish attempts
What to Expect
If the yearly low holds, PopCat may attempt a relief bounce, but failure to break dynamic resistance keeps the market biased lower.

POPCAT/USDT Setup IdeaCurrent Market View
Price appears to be attempting a breakout of the channel into a new upward trend channel (marked in white/grey).
On the hourly chart, momentum oscillators (RSI, MACD) show early signs of shift: RSI is climbing from oversold/neutral area; MACD lines are converging.
The 4-hour and daily charts suggest the downtrend is still in place, but the breakout attempt may signal a reversal if sustained.
Proposed Entry & Exit Levels
Entry Zone (Buy Setup)
Entry: around $0.102 – $0.106 USDT if the price successfully breaks above the upper boundary of the descending channel and closes above it.
Stop-Loss (Risk Control)
Stop-loss below the recent swing low and the lower channel boundary: around $0.095 – $0.098 USDT.
Take-Profit Targets
TP1: $0.115 – $0.118 USDT (initial target upon channel breakout)
TP2: $0.125 – $0.130 USDT (next psychological level if momentum carries)
TP3 (extended): $0.140 USDT or more – only if the broader trend turns bullish and volume supports.
This means while the setup has potential, risk is elevated — especially if the breakout fails or broader market turns negative.
As always, use a stop‑loss, manage your risk, and only allocate what you’re comfortable with. Good luck!

POPCAT ready to jump?Is the cat preparing to jump?
Divergences have started forming right on a strong support level — a clear hint that the asset may be getting ready for a reversal.
Based on the bid/ask ratio, the coin is currently among the top ones: demand is dominating, and market sentiment is positive. Right now it looks like the market sees further upside as a realistic scenario.
Watching closely. If it “jumps,” the move could be strong.

POPCAT Update📊 POPCAT Update
POPCAT is facing a strong red resistance zone 🔴 on the daily time frame ⏰
Until it breaks out above this level, there’s no major sign of a bullish reversal trend ⚠️
Patience is key — wait for a clear breakout confirmation before jumping in 📉➡📈

PoP Cat ShortAfter a quick short signal earlier. we have another according to our strategy.
Targets on chat
DyOr

PoPcat Short Popcat has moved a quite a bit and there's small correction. Targets on the charts
DyOR
POPCAT's Situation (3D) !!!So if you pay attention to the POPCAT chart you can see that the price has formed a Ascending wedge which means it is expected to price move as equal as the measured price movement.( AB=CD )
NOTE: wait for break of the WEDGE .
Best regards CobraVanguard.💚

POPCAT/USDT — Descending Triangle: Ready for a Major Move?1. Current Market Condition
POPCAT/USDT is sitting at a very critical level. After a prolonged downtrend since late 2024, the price has formed a clear descending triangle, with consistent lower highs pressing from above while the 0.22–0.30 support zone continues to act as a strong demand area.
This setup signals compressed volatility — price is being squeezed toward the apex of the triangle, usually leading to a significant breakout in either direction.
---
2. Key Technical Levels
Major Support Zone (Yellow Box): 0.22 – 0.30
Immediate Resistance: 0.3427 → 0.4067
Mid-range Resistance: 0.5714 → 0.8874
High Resistance Levels: 1.5238 → 1.9510
Extreme Support (if breakdown): 0.0869
---
3. Pattern Explanation
Descending Triangle → classically a bearish continuation pattern, but in crypto, it can also flip into a reversal if broken to the upside with strong volume.
Price Compression → narrowing range suggests a “build-up of energy” for a big move.
Historical Demand Zone → the yellow box has been repeatedly tested since 2024, making it a decisive battleground for bulls and bears.
---
4. Bullish Scenario
Confirmation: 2D candle close above the descending trendline and 0.34–0.35 with strong volume.
Upside Targets:
First target: 0.4067
Mid target: 0.5714
Extended target (if momentum continues): 0.8874
Bullish Flow: Breakout followed by a successful retest of the broken trendline as new support would strongly validate the bullish case.
---
5. Bearish Scenario
Confirmation: 2D candle close below 0.22 with high volume.
Downside Targets:
Initial target: 0.17–0.13
Extended target: 0.09 (historical low)
Bearish Flow: A breakdown of the major support opens the door to an extended downtrend, as liquidity beneath 0.22 is thin.
---
6. Conclusion & Trader Notes
POPCAT is at a make-or-break point. Holding the demand zone and breaking to the upside could trigger a significant rally, while losing support would resume the downtrend.
Conservative traders → wait for confirmation: breakout above 0.34 or breakdown below 0.22.
Aggressive traders → may accumulate small positions near support with tight stop-losses.
Key factor: breakout volume, 2D candle closes, and retest behavior at support/resistance.
This is a textbook example of the market “holding its breath” before a decisive move.
---
POPCAT is locked inside a descending triangle, pressing against the 0.22–0.30 support zone. The market is at a crossroads — will bulls push for a breakout toward 0.40 – 0.57 – 0.88, or will bears take control with a breakdown below 0.22 and drive price to 0.13–0.09?
The triangle is near its apex. A breakout or breakdown in the coming weeks could define the next major trend for POPCAT. Traders should prepare their strategies now, as the market’s decision is approaching.
---
#POPCAT #POPCATUSDT #CryptoAnalysis #DescendingTriangle #Breakout #BullishCase #BearishCase #AltcoinAnalysis #CryptoTrading

BEARISH SELL ON POPCATUSDTConfluences for the sell are-
1) Market Structure- BoS
2) POI/Key Level- Trendline & Supply
3) Quasimodo(QM)
Note: the market is all about probabilities which also makes my analysis a probability.

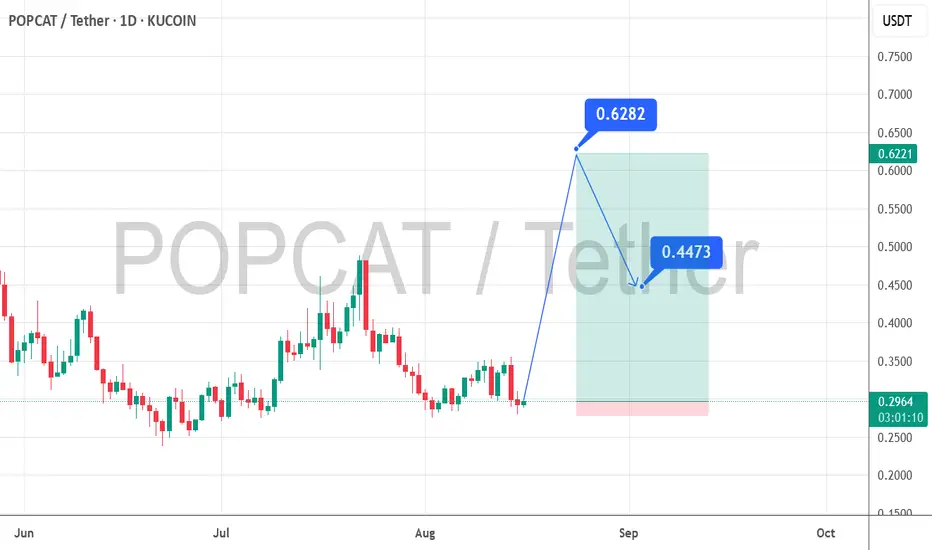
POPCATUSDT 100% Gains? After a period of consolidation, POPCAT is beginning to show signs of a bullish reversal. Indicators such as MACD and RSI are turning positive, and trading volume is on the rise — a classic setup for a breakout. If the price successfully breaks above the key resistance at $0.38, the next target could be around $0.63, representing a potential 100% gain from current levels.
Recent candlestick patterns also suggest strong buying pressure on the 4-hour and daily timeframes. With confirmation above resistance, this altcoin could be entering a powerful rally phase.
POPCAT/USDT – Weekly Chart TAPOPCAT/USDT – Weekly Chart TA
Price abhi bhi falling channel ke andar trade ho raha hai, lekin support zone se bounce ka chance hai.
Key Support Zones:
0.2536 – 0.2500 USDT
0.1567 USDT (major last defense)
Breakout Confirmation:
Agar price 0.4290 ke upar close deta hai toh pehla target 0.5301 USDT hoga.
Iske baad potential rally ka agla phase open ho sakta hai.
Possible Scenarios:
Bullish – Channel break + retest → rally towards 0.53 → 0.70 → 1.30
Bearish – Support break → 0.1567 retest
📌 Weekly timeframe par patience zaroori hai.
⚠️ Spot safe, leverage par sirf breakout confirmation ke baad hi entry lo.
Quote: "The market is a device for transferring money from the impatient to the patient." – Warren Buffett

POPCATlet see what will happen my expactation it is. it is doing w and high. there is idm level and below of it exist fvg and order block when you check daily and weekly you will see the level which i mention

POPCAT - Time to buy again!The triangle pattern will break in the direction it is breached, and the price will move in that direction. In my opinion, the price could be bullish and may up to $0.50.
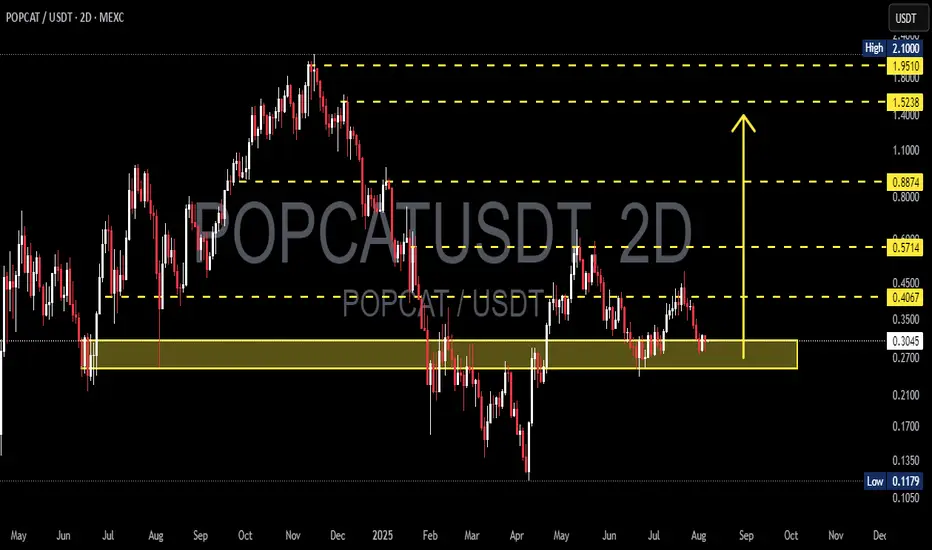
POPCAT/USDT – Testing Demand Zone: Reversal or Breakdown?POPCAT/USDT is currently retesting one of the most crucial demand zones in its mid-term price structure, located between $0.2700 – $0.3037. This area has historically acted as a strong support level and has triggered significant rebounds in the past. The market's reaction here will be key in determining whether POPCAT is ready for a bullish reversal or heading for a deeper correction.
---
🔍 Market Structure & Price Action
The price has entered a sideways consolidation phase after a steady decline from the $0.4067 region.
So far, the support zone at $0.2700 has been respected multiple times, indicating buying interest remains active.
However, no clear bullish reversal pattern has formed yet, making the next movement critical.
---
🟢 Bullish Scenario (Reversal / Bounce)
If the price manages to hold above this demand zone and forms a higher low along with a strong bullish candlestick confirmation, we could see a potential trend reversal.
🎯 Potential bullish targets:
TP1: $0.4067 – Minor resistance, top of the current range.
TP2: $0.5714 – Mid-range resistance, a previous breakdown zone.
TP3: $0.8874 – Major resistance, the last high before the steep drop.
TP4: $1.5238 – $1.9510 – Psychological resistance zone, possible medium-term swing targets if bullish momentum strengthens.
🔐 Key confirmations:
Bullish engulfing / hammer candlestick on the 2D chart.
Increase in volume + breakout above range resistance.
---
🔴 Bearish Scenario (Breakdown Continuation)
If the price fails to hold $0.2700 and we see a clear daily or 2D candle close below the demand zone, this would indicate loss of bullish strength and open room for further downside.
🎯 Bearish targets:
TP1: $0.2100 – Psychological support level.
TP2: $0.1179 – All-time low and historical bottom.
⚠️ Risk factors:
Strong bearish candle close + high volume breakdown would confirm sellers’ dominance.
---
🧩 Pattern & Formation Insights
A horizontal base / accumulation range is visible within the demand zone.
If the price rebounds, we could be forming a double bottom – a classic reversal signal.
However, if the zone breaks, the chart may develop into a descending channel or bearish continuation pattern.
---
🧠 Trading Strategy Outlook
Swing Traders: Consider long entries within the demand zone ($0.2700–$0.3037) with a tight stop-loss just below the zone. Aim for multiple resistance levels as take-profit targets.
Breakout Traders: Wait for confirmation above $0.4067 with increased volume.
Bearish Setup: Short entry upon breakdown below $0.2700 with targets towards the next support zones.
#POPCAT #AltcoinAnalysis #CryptoTechnicalAnalysis #DemandZone #BreakoutOrBreakdown #USDT #MEXC #SwingTrade #CryptoSetup #BullishReversal #BearishBreakdown #ChartAnalysis #TradingView
POPCAT down trend buy at weekly low BBPOPCAT andn All altcoins are in downtrend for past few days.
Both 3d and weekly charts not showing any reversal yet.
We have a plan and hope for weekly BB low band touch where we will load up. around
Patience is the key here.

$POPCAT – Patience Before the Pounce
BYBIT:POPCATUSDT holding up well—expecting a move after 2 weeks of ranging.
Starting to slowly scale in around 30c and under (if you haven't already).
Will reassess if 24c is lost and stays below for too long.
Still targeting $1 if momentum kicks in.

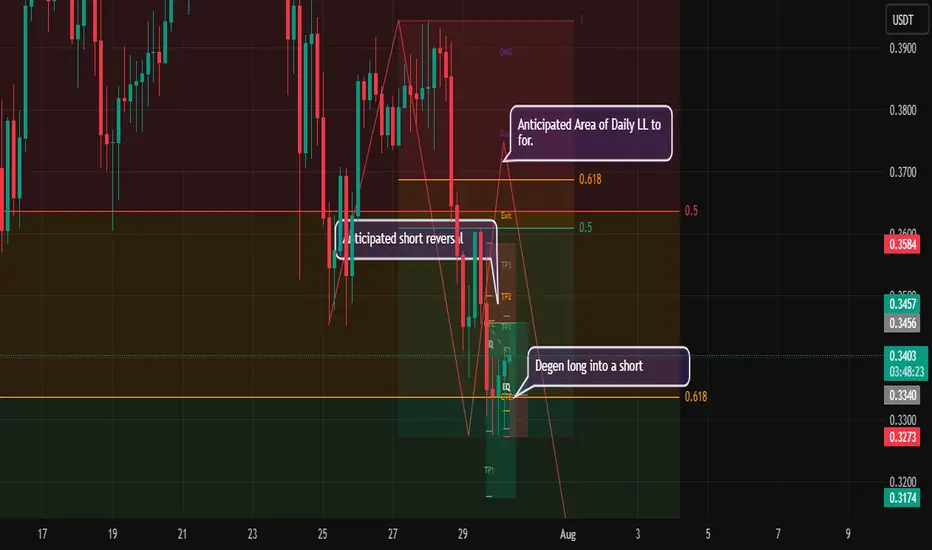
Week#3_July Wrapping_Trade #6 of week#3. PursuitOfConsistencyAs I waiting for a formation on a high probability short swing to form,
Am looking to play a degen long into a short zone and short the market lower between Asian and London session. I won't have the same Idea for NY.
If it trade NY, I will coin a thesis based on the close of London structure.
Otherwise I might wait through Friday or the weekend or whenever for my model to form.
POPCATUSDT – Breakout Confirmation or False Signal?On the daily chart of POPCATUSDT, the price has recently broken out of a descending trendline that has been acting as resistance since December 2024. This breakout signals a potential trend reversal from bearish to bullish.
Currently, the price is in a retest phase, revisiting the breakout zone, which also aligns with a strong support and Fibonacci retracement area:
Support zone: $0.34 – $0.38
Fibonacci 0.618: $0.3490 (major technical support)
Fibonacci 0.5: $0.3759 (typical retest level after breakout)
If the price holds above this zone and forms a bullish confirmation candle, it strengthens the case for continued upward momentum.
---
Pattern and Market Structure:
Descending Triangle Breakout: The price has broken out of a long-standing descending triangle pattern, which is typically a bullish reversal signal — especially if supported by volume (not shown in chart but crucial).
Neckline Retest: The current move is retesting the breakout zone, a common behavior after significant breakouts.
---
Bullish Scenario:
If the price holds above the $0.34–$0.38 zone and forms bullish price action:
Potential targets based on Fibonacci levels:
Target 1: $0.5665
Target 2: $0.7254
Target 3: $0.9358
Major targets: $1.2247 and possibly $1.6029 if bullish momentum sustains
---
Bearish Scenario:
If the price fails to hold above $0.34 and breaks down below the support:
Potential downside towards $0.26 – $0.20 zone
If selling pressure intensifies, it may revisit the key support low around $0.1178
---
Conclusion:
POPCATUSDT is at a critical decision point. The breakout from the descending trendline is an early bullish signal, but confirmation from the $0.34–$0.38 retest zone is essential. If it holds, a strong bullish rally may follow. However, a failure to hold could signal a false breakout and resume the bearish trend.
#POPCAT #POPCATUSDT #CryptoBreakout #AltcoinAnalysis #ChartPatterns #TechnicalAnalysis #FibonacciLevels #CryptoTrading #BullishSetup #BearishScenario

POPCATUSDT 1D#POPCAT is consolidating inside a symmetrical triangle on the daily chart — decision time is approaching. Will it break out upwards or downwards?
We plan to accumulate near the support level at $0.3319, which aligns closely with both the triangle support and the daily SMA50.
If a breakout occurs to the upside, the potential targets are:
🎯 $0.5814
🎯 $0.7088
🎯 $0.8682
🎯 $1.1000
🎯 $1.3317
🎯 $1.6617
🎯 $2.0821
However, if the price breaks below the triangle, it could retest the lower support at $0.2304.
⚠️ As always, use a tight stop-loss and manage your risk accordingly.

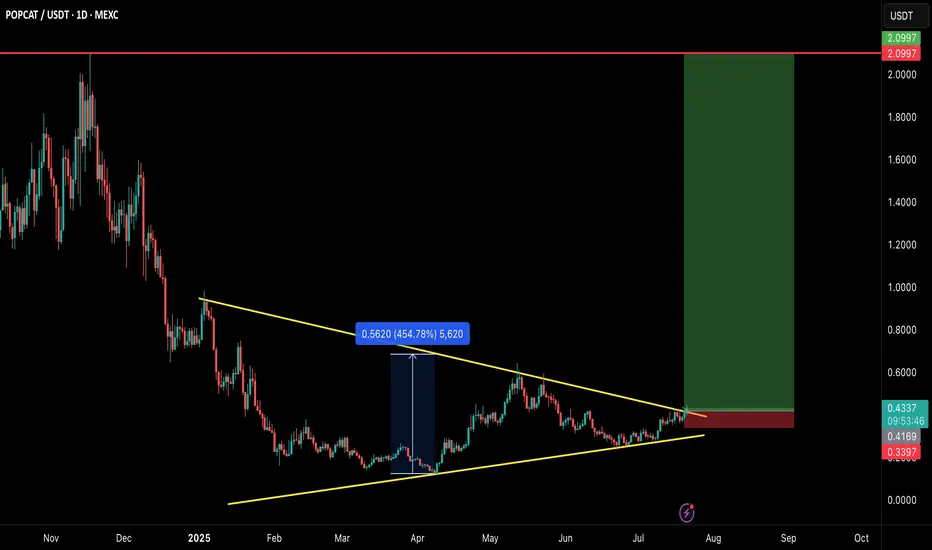
POPCAT/USDT – MEGA BREAKOUT INCOMING!POPCAT is breaking out of a large symmetrical triangle structure that has been developing for several months. This is a textbook bullish reversal setup with explosive potential — and the chart says it all! 👇
🧠 Technical Breakdown:
✅ Clean symmetrical triangle breakout on daily timeframe
🔥 Strong base formation followed by volume breakout
💹 Consolidated above trendline for weeks — breakout looks real
🛒 Entry Zone:
CMP ($0.43) or buy in dips toward $0.40–$0.42
🎯 Targets:
TP1: $0.65
TP2: $1.10
TP3: $1.60
TP4: $2.10
🛑 Stop-loss:
Close below $0.34
📊 Risk/Reward:
Solid RR > 4.0 with high potential if momentum kicks in. Volume and structure both support a strong upside.
📢 Final Thoughts:
This is not just a breakout — it's a multi-month accumulation breakout. If the market stays bullish, POPCAT could go parabolic again just like it did earlier.
🚨 Always use proper risk management and SL!
💬 Drop your thoughts in comments & don’t forget to hit that ❤️ if you find this helpful.
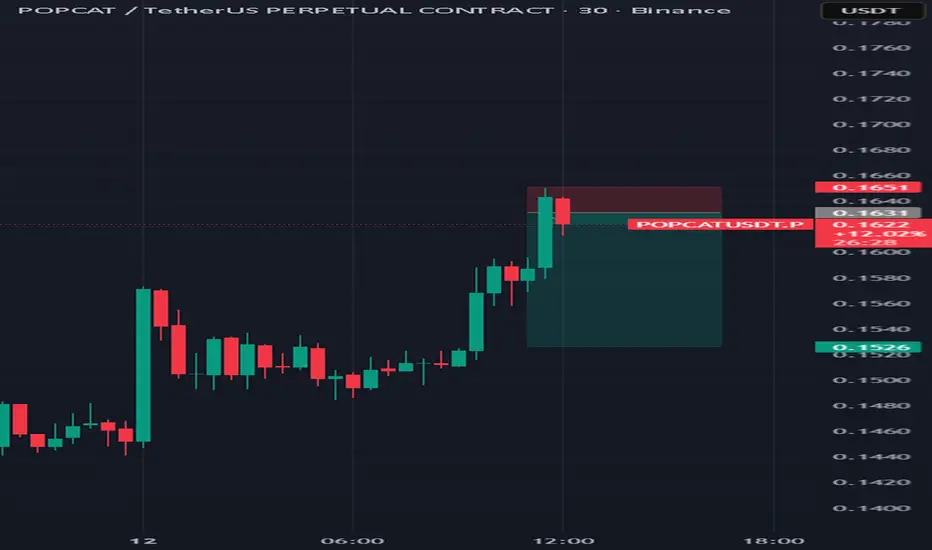
$POPCAT TARGETIt’s been several target hits over the weekend🤩🤩🤩
Someone shout BYBIT:POPCATUSDT.P
Aren't you excited? Well, I am!!!
This trade right here is a whooping 1:4.6RR nearly 1:5RR bringing in so much to the portfolio.
After the correction that happened on Friday, I saw a good opportunity to enter for LONG in many pairs. Yesterday being Sunday despite not being on chart, I was getting notifications of closed trades All in PROFIT, YES!!!
Today seems to give some corrections but I'm overly bullish. we just have to wait for the right entries and boom again.
WILL POPCAT HAVE A NEW WHALE VOLUME?POPCAT seems interesting then never before, even with the last correction, are we going to see a new increase round by POPCAT? The time will show, the interest is here.
If this coin is able to make new confirmations, the updates will be below.
