TRG – SHORT SELL / EXIT SIGNAL (FLIP TRADE) | 20 JULY 2025TRG – SHORT SELL / EXIT SIGNAL (FLIP TRADE) | 20 JULY 2025
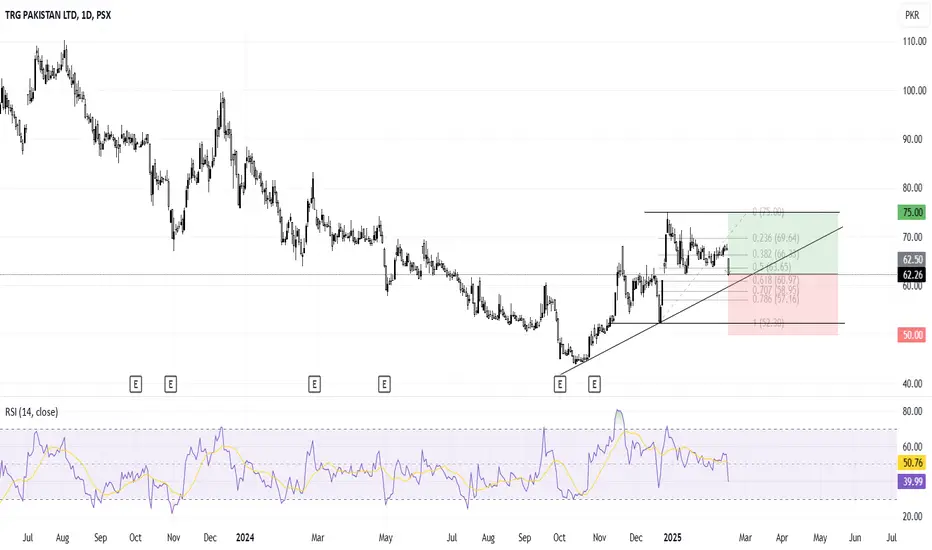
TRG has maintained a bearish market structure, consistently printing lower highs and lower lows—confirming an established downtrend. After a short-term retracement to the 20 EMA, the stock has resumed its downward movement, suggesting that f
−18.53 PKR
−30.85 B PKR
2.56 M PKR
504.91 M
About TRG PAKISTAN LTD
Sector
CEO
Hasnain Aslam
Website
Headquarters
Karachi
Founded
2002
ISIN
PK0079201015
FIGI
BBG000PWQ208
TRG Pakistan Ltd. is a holding company, which engages in investing in a portfolio of investments primarily in the technology and IT services sectors. The company was founded on December 2, 2002, and is headquartered in Karachi, Pakistan.
Related stocks

TRG FALLING WEDGE 2x... 3X...4X...?TRG ELITE KATCHRA💎
CMP: 58.76
From forgotten junk to potential multi-bagger 2x... 3X...4X...? will see what unfolds...
TRG is showing signs of a potential long-term reversal after a multi-year downtrend. Price action is compressing within a large falling wedge pattern, typically a bullish format

TRG LongTRG has made a perfect bullish harmonic pattern where it has retraced to exact 127.2% of its last top and now will move till 161.8% of its all-time high which is nearly 295. This is not a buy/sell call, its just my own analysis and you may disagree. However, I'd urge you to study bullish and bearish

TRG LONG TRADETRG was in BULL RUN since March 2020 to April 21, it is trending in bullish channel since 2020, it has now bottomed out in this channel as seen in 1W chart at bottom.
As seen in 1D chart it has given bullish reversal on heavy volumes on upward leg and much lighter volume on downward pullback, furth

TRG, Buy Opportunity is coming up !Buy once price closes above BB50
Price target1: 92.59
Price Target2: 150

TRG LONGTERM ANALYSIS AND NEW ALL TIME HIGH COMINGTRG has been in Pullback since May 2021 when it posted its ATH of Rs 186.
It has reached 78% level of retracement and is rebounding from !M FVG(Fair Value Gap).
It is very much likely to start a long term bullish move after it crosses Rs74 level to make new high of Rs 230 In Sha Allah

TRG Bullish Reversal: Buy at Golden PocketTRG is trending after a prolonged bearish phase, forming higher highs and higher lows. It is currently trading around the Fibonacci golden pocket. A buy entry at the current market price is suggested, with a stop loss below the last low and a target at the recent high.
TRG: IN BULLS CONTROLCurrently TRG is trading above a critical level, as marked on the chart. We may initiate a long position with risk and tp defined on the chart.
Good Luck

trg about to breakoutfollowing symmetrical triangle perfectly, needs a breakout from 68.5 and then to 75.. or above shown divergence at 4hrs. previous up move could follow next expected price target. 4hr closing above rsi 50 is necessary for upward breakout


See all ideas
Summarizing what the indicators are suggesting.
Oscillators
Neutral
SellBuy
Strong sellStrong buy
Strong sellSellNeutralBuyStrong buy
Oscillators
Neutral
SellBuy
Strong sellStrong buy
Strong sellSellNeutralBuyStrong buy
Summary
Neutral
SellBuy
Strong sellStrong buy
Strong sellSellNeutralBuyStrong buy
Summary
Neutral
SellBuy
Strong sellStrong buy
Strong sellSellNeutralBuyStrong buy
Summary
Neutral
SellBuy
Strong sellStrong buy
Strong sellSellNeutralBuyStrong buy
Moving Averages
Neutral
SellBuy
Strong sellStrong buy
Strong sellSellNeutralBuyStrong buy
Moving Averages
Neutral
SellBuy
Strong sellStrong buy
Strong sellSellNeutralBuyStrong buy
Displays a symbol's price movements over previous years to identify recurring trends.
Frequently Asked Questions
The current price of TRG is 58.02 PKR — it has decreased by −1.22% in the past 24 hours. Watch TRG PAKISTAN LTD stock price performance more closely on the chart.
Depending on the exchange, the stock ticker may vary. For instance, on PSX exchange TRG PAKISTAN LTD stocks are traded under the ticker TRG.
TRG stock has risen by 2.57% compared to the previous week, the month change is a −1.08% fall, over the last year TRG PAKISTAN LTD has showed a 8.04% increase.
TRG stock is 2.40% volatile and has beta coefficient of 0.98. Track TRG PAKISTAN LTD stock price on the chart and check out the list of the most volatile stocks — is TRG PAKISTAN LTD there?
Today TRG PAKISTAN LTD has the market capitalization of 31.83 B, it has decreased by −4.16% over the last week.
Yes, you can track TRG PAKISTAN LTD financials in yearly and quarterly reports right on TradingView.
TRG net income for the last quarter is −299.75 M PKR, while the quarter before that showed 1.91 B PKR of net income which accounts for −115.72% change. Track more TRG PAKISTAN LTD financial stats to get the full picture.
As of Aug 7, 2025, the company has 6 employees. See our rating of the largest employees — is TRG PAKISTAN LTD on this list?
EBITDA measures a company's operating performance, its growth signifies an improvement in the efficiency of a company. TRG PAKISTAN LTD EBITDA is −584.43 M PKR, and current EBITDA margin is −12.75 K%. See more stats in TRG PAKISTAN LTD financial statements.
Like other stocks, TRG shares are traded on stock exchanges, e.g. Nasdaq, Nyse, Euronext, and the easiest way to buy them is through an online stock broker. To do this, you need to open an account and follow a broker's procedures, then start trading. You can trade TRG PAKISTAN LTD stock right from TradingView charts — choose your broker and connect to your account.
Investing in stocks requires a comprehensive research: you should carefully study all the available data, e.g. company's financials, related news, and its technical analysis. So TRG PAKISTAN LTD technincal analysis shows the neutral today, and its 1 week rating is sell. Since market conditions are prone to changes, it's worth looking a bit further into the future — according to the 1 month rating TRG PAKISTAN LTD stock shows the sell signal. See more of TRG PAKISTAN LTD technicals for a more comprehensive analysis.
If you're still not sure, try looking for inspiration in our curated watchlists.
If you're still not sure, try looking for inspiration in our curated watchlists.