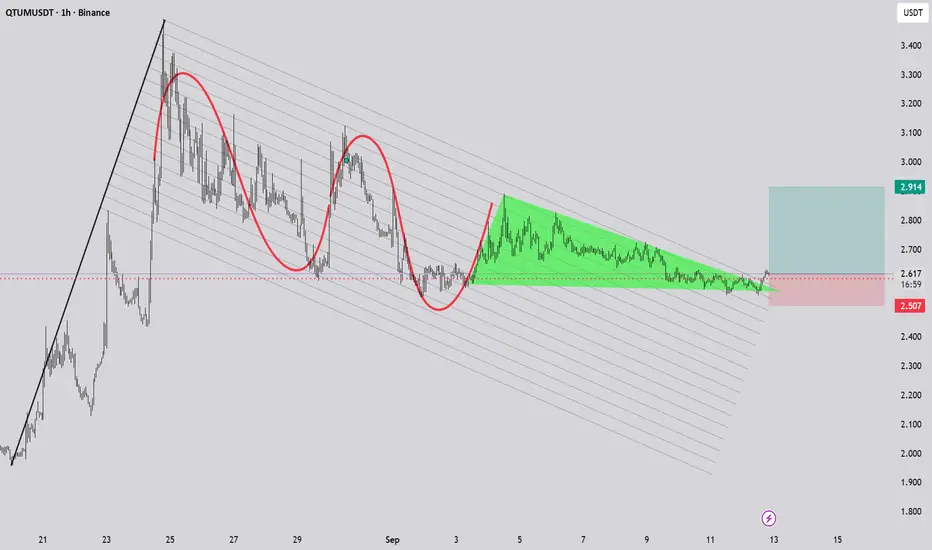
QTUMUSDT Forming Falling WedgeQTUMUSDT is forming a clear falling wedge pattern, a classic bullish reversal signal that often indicates an upcoming breakout. The price has been consolidating within a narrowing range, suggesting that selling pressure is weakening while buyers are beginning to regain control. With consistent volume confirming accumulation at lower levels, the setup hints at a potential bullish breakout soon. The projected move could lead to an impressive gain of around 90% to 100% once the price breaks above the wedge resistance.
This falling wedge pattern is typically seen at the end of downtrends or corrective phases, and it represents a potential shift in market sentiment from bearish to bullish. Traders closely watching QTUMUSDT are noting the strengthening momentum as it nears a breakout zone. The good trading volume adds confidence to this pattern, showing that market participants are positioning early in anticipation of a reversal.
Investors’ growing interest in QTUMUSDT reflects rising confidence in the project’s long-term fundamentals and current technical strength. If the breakout confirms with sustained volume, this could mark the start of a fresh bullish leg. Traders might find this a valuable setup for medium-term gains, especially as the wedge pattern completes and buying momentum accelerates.
✅ Show your support by hitting the like button and
✅ Leaving a comment below! (What is your opinion about this Coin?)
Your feedback and engagement keep me inspired to share more insightful market analysis with you!
Market insights

QTUMUSDT 12H#QTUM is currently trading within a descending channel on the 12H chart. Consider buying around the current level and within the support zone between $1.793 – $1.725. In case of a breakout above the channel resistance, the potential upside targets are:
🎯 $2.052
🎯 $2.191
🎯 $2.376
🎯 $2.561
🎯 $2.824
⚠️ Always remember to use a tight stop-loss and maintain proper risk management.

QTUM – The Sleeping Giant About to Explode
💎 Hidden Gem Alert! 💎
I think I just found one of the most underrated coins in the market — QTUM / USDT
On the **daily timeframe**, this setup looks absolutely explosive!
The structure, the accumulation, the momentum — everything is aligning for a potential **10x move** from here!
Most people are still sleeping on it, but this chart screams **“major breakout incoming”**.
It’s like discovering a **diamond before everyone else realizes its true value**.
Keep an eye on this one…
Because when **QTUM** wakes up, it won’t wait for anyone.
#QTUM #crypto #trading #hiddenGem #10x #altcoin #breakout #bullish


QTUM – an interesting asset for a long positionQTUM seems to have already reached its bottom and is now showing strong upward momentum.
According to the most conservative projections, I plan to take profits at the marked level (around 70%), while keeping 30% of the position open in case of a possible move toward $1.
All ideas are published for my personal trading history.
Any copying of trades is done at your own risk.
Always remember — don’t risk money you can’t afford to lose.

QTUMUSDT Forming Bullish ContinuationQTUMUSDT is currently showing a bullish continuation pattern, signaling strong potential for the next leg of upward movement. After a healthy consolidation phase, the price appears to be gearing up for a breakout, supported by consistent trading volume and renewed investor interest. The market structure suggests that QTUM is maintaining higher lows — a key indicator that bullish momentum is gradually building strength and preparing for a significant upside move.
With increasing buying pressure and stable liquidity, QTUMUSDT could be positioned for a 70% to 80% price gain in the short to medium term. The pattern formation reflects ongoing confidence among traders who are accumulating during this consolidation phase, anticipating a breakout that aligns with broader market recovery signals. This setup is often seen before major impulsive rallies in trending markets.
Investors have been showing growing interest in QTUM due to its consistent performance and strong fundamentals within the blockchain ecosystem. The current price action aligns with market optimism, suggesting that once resistance is broken, momentum could accelerate quickly, driving prices toward new local highs.
✅ Show your support by hitting the like button and
✅ Leaving a comment below! (What is You opinion about this Coin)
Your feedback and engagement keep me inspired to share more insightful market analysis with you!

QTUMUSDT — Testing Historical Support, Accumulation or BreakdownQTUM/USDT is now sitting at one of the most crucial levels in its entire price history. The pair is once again retesting the $1.60 – $2.20 historical support zone, a level that has acted as a strong foundation multiple times since 2020. How price reacts here will determine whether QTUM enters a new accumulation phase with upside potential, or finally breaks down into fresh historical lows.
---
🔎 Technical Structure & Historical Context
Long-Term Trend:
Since the 2021 all-time high, QTUM has been in a persistent downtrend with a clear pattern of lower highs. Despite this, the $1.60 – $2.20 zone has held strong for over 5 years, acting as a major demand zone.
Key Support Zone:
$1.60 – $2.20 (yellow box). Every major retest since 2020 has resulted in a significant bounce, making this one of the most critical levels for QTUM.
Important Resistance Levels (Upside Targets):
$2.70 → nearest resistance, first bullish checkpoint.
$3.53 → major confirmation level; a breakout above could signal a structural reversal.
$4.93 → medium-term target and strong supply zone.
Higher-term resistances: $8.70 → $17.36 → $27.58 (only achievable in a macro bullish cycle).
Critical Downside Support:
If $1.60 fails, QTUM could revisit $1.00 and potentially its all-time low at $0.71.
---
📈 Bullish Scenario (Potential Accumulation & Reversal)
1. Price holds above $1.60 – $2.20 and prints a strong bullish weekly candle with rising volume.
2. Breakout above $2.70 would serve as the first reversal signal.
3. Stronger confirmation comes with a close above $3.53.
4. Upside targets: $2.70 → $3.53 → $4.93. If $4.93 is broken, momentum could carry QTUM to $8.70+.
Interpretation:
This would complete a multi-bottom accumulation pattern, often the foundation of a larger bullish cycle after prolonged sideways action.
---
📉 Bearish Scenario (Descending Triangle Breakdown)
1. Price fails to hold $1.60 – $2.20.
2. Weekly close below $1.60 confirms breakdown.
3. Downside targets: $1.00 → $0.71 (historical low).
4. The chart currently resembles a descending triangle, with a flat support and lower highs pressing down. A breakdown here could trigger heavy selling pressure.
Interpretation:
Losing this support would likely mark a continuation of the multi-year downtrend that began in 2021.
---
🧭 Conclusion & Trading Strategy
The $1.60 – $2.20 support zone is QTUM’s “life or death” level.
Bullish bias confirmed on a weekly close > $2.70, with stronger reversal above $3.53.
Bearish bias confirmed on a weekly close < $1.60, targeting $1.00 → $0.71.
Swing Trading Approach:
Consider scaling entries within $2.00 – $2.20.
Place stop-loss just below $1.55.
Take profit targets: $2.70 / $3.53 / $4.93.
If breakdown occurs → cut losses quickly or look for short setups after a retest.
Investor Perspective:
This zone could be an attractive accumulation area given its historical significance. However, risk management is critical: if $1.60 breaks, QTUM could revisit historical lows.
---
📊 Key Takeaways
Weekly close is far more important than intraday wicks.
Watch volume and momentum indicators (RSI, OBV) for confirmation of strength.
QTUM is at one of its most critical levels in the past 5 years: either a major accumulation base for a bullish cycle, or a breakdown into historical lows.
---
#QTUM #QTUMUSDT #Crypto #Altcoin #TechnicalAnalysis #SupportResistance #CryptoTrading #ChartAnalysis

QTUM/USDT - H1- LONG
Dear friends,
I warmly invite you to like this post, leave a comment with your thoughts, and share it with your friends. Your support truly means the world to me!
Your likes, comments, and shares are incredibly inspiring and encourage me to create and share more analysis with you all.
Thank you so much for your kindness and encouragement!
Warm regards,
Max
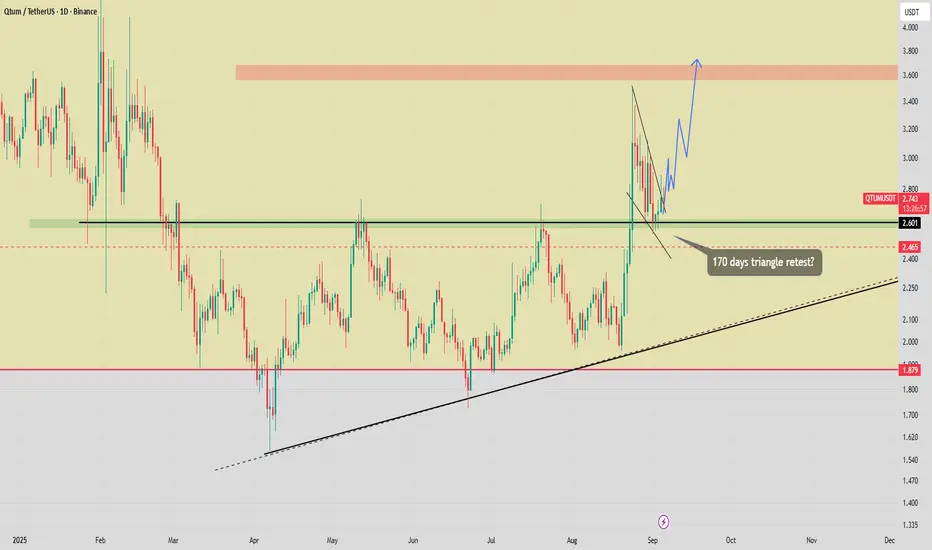
$QTUM - 170 days ascenting triangle breakoutNASDAQ:QTUM - 170 days ascenting triangle breakout & retest still in play! 📈
TP3 hit ✅, the real move have not event started!
Remember: 2.550 - 2.500$ demand zone is key.
QTUMUSDT Forming Falling WedgeQTUMUSDT is currently forming a falling wedge pattern, a highly recognized bullish reversal structure in technical analysis. This setup indicates that the prolonged selling pressure is weakening and buyers are gradually stepping in to regain control. As price tightens within the wedge, a breakout to the upside becomes increasingly likely, signaling the beginning of a fresh bullish phase.
Volume activity is showing healthy participation, which strengthens the case for a potential breakout. If momentum continues to build, QTUMUSDT could see a strong rally, with an expected upside gain of nearly 60% to 70%+. This projected move would place the pair in a favorable zone for both swing traders and long-term investors seeking strong technical setups.
Market participants are taking notice of QTUM’s current positioning, as the coin’s structure and momentum align with broader bullish patterns seen across the crypto market. Growing investor interest and strong accumulation at these levels provide an additional layer of confidence for a breakout scenario.
In summary, QTUMUSDT is at a crucial stage where the falling wedge breakout could fuel significant upward momentum. With strong volume support and rising investor confidence, this pair has the potential to deliver solid gains in the coming weeks.
✅ Show your support by hitting the like button and
✅ Leaving a comment below! (What is You opinion about this Coin)
Your feedback and engagement keep me inspired to share more insightful market analysis with you!


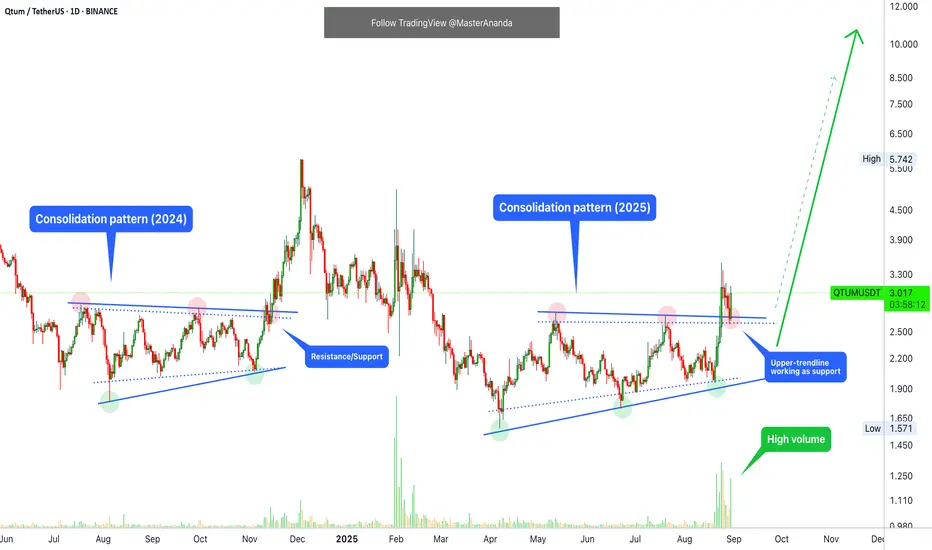
Qtum Confirms Altcoins Market Bullish Bias · Bitcoin & MoreThis chart looks great and it is a chart that we have seen hundreds of times before, literally. It will be great to prove our point and also for us to reinforce our current map of the market. We know where the market is headed; here we have the proof.
QTUMUSDT hit a low 7-April 2025, the same with most of the altcoins market. This is the main low and even though there are different dates, some in March and February while others in June and August, the main 2025 low comes as the end of the correction from the peak in 2024.
Back in 2024 there was a consolidation period (blue lines) very similar to what we are seeing now. The end result of the consolidation period was a bullish jump of course but this move was corrected by more than 100% and this led to today's chart.
The beyond 100% correction is good because it opens the doors for a new bullish cycle. Growth potential becomes unlimited because the previous move was fully corrected.
This is the same chart we saw hundreds of times before but something is different. QTUMUSDT is no longer trading within the "opportunity buy zone." Look at it. QTUM is not trading at bottom prices. So the same, but prices are higher.
A low in April then sideways and while sideways we get higher lows. Notice how the breakout from the consolidation range produces really high volume. This is what shows this is a real move.
Then we have the upper-trendline of the range, it was broken and six days later tested as support and it holds. This is the confirmation.
Moving above resistance is a bullish development. After a break of resistance such as the consolidation pattern we have here, there is always a small retest and this is what you see after 24-Aug. 29-Aug support is found and today prices start to grow. Resistance has been flipped support and this is the confirmation.
We can also compare QTUM to BTC as we did with DOGE and SKL.
Bitcoin peaked 14-August and started to move lower, etc. Until this day.
Qtum was trading low already, near the lower boundary of the trading range on 14-August. From this point, it started to grow and produced a major high 24-Aug. The highest prices since February 2025, 7 months ago.
Most of the altcoins we track and trade have the same chart. With this, you can predict what will happen with the rest of the market, and you also have confirmation about Bitcoin's next move.
It is like cheating and it is just too easy... All the information is available on the charts. The Cryptocurrency market will continue growing. Here you have the proof.
Namaste.
QTUM Market Update📊 NASDAQ:QTUM Market Update
NASDAQ:QTUM is now testing the red resistance zone 🔴 where sellers remain active.
If buyers achieve a confirmed breakout, it could signal the continuation of the bullish trend ✅
👉 The first target on breakout is the green line level 🎯
👉 Clearing this zone would show strong buyer momentum and open the path for further upside.
⚠️ Reminder: Always wait for confirmation — resistance zones often trigger fakeouts before a true move.
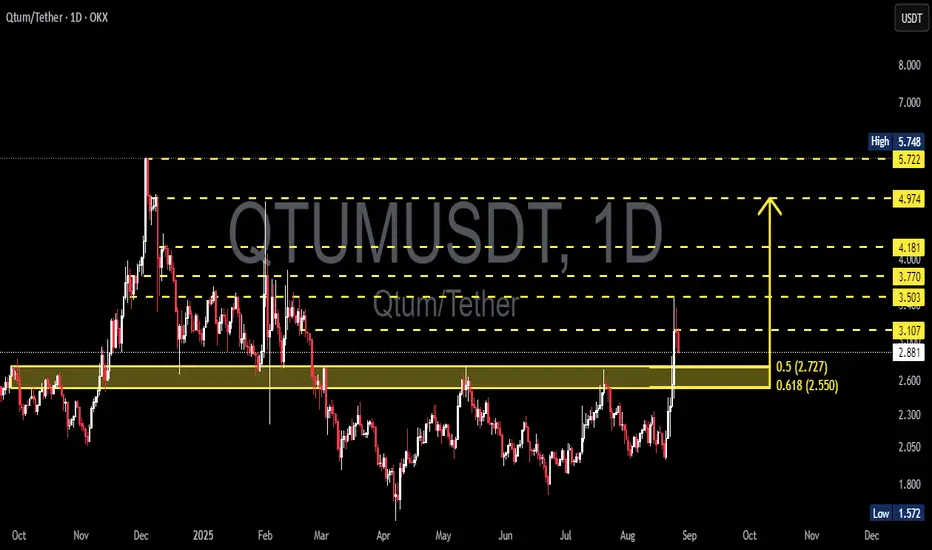
QTUM/USDT – Golden Pocket Retest as Key Decision Zone!Summary:
QTUM has just made a major breakout from its long-standing range and tapped into strong resistance around 3.10–3.50. Currently, the price is pulling back into the Golden Pocket confluence zone (Fibonacci 0.5–0.618 at 2.55–2.77), which previously acted as a strong resistance and is now being tested as support (SR-Flip). The reaction at this zone will be the key driver for the next big move.
---
🔍 Structure & Pattern
Range Breakout: QTUM escaped months of sideways consolidation.
Golden Pocket (2.55–2.77): former resistance, now tested as support.
Wick Rejection: the last candle rejected around 3.10, showing near-term supply pressure.
BOS (Break of Structure): new higher-high is formed; validation requires a higher-low above 2.55–2.77.
---
🚀 Bullish Scenario
1. Successful Retest at Golden Pocket (2.55–2.77)
Strong bounce confirms structure shift.
Targets: 3.107 → 3.503 → 3.770.
Extended targets if momentum sustains: 4.00–4.181 → 4.974 → 5.72–5.75 (previous high).
2. Reclaim of 3.10 Resistance
A daily close above 3.10 would strongly favor further bullish continuation.
---
🩸 Bearish Scenario
1. Failure to Hold Golden Pocket (daily close < 2.55)
Breakout becomes a false breakout, price falls back into the old range.
Downside targets: 2.30 → 2.05 → 1.80 → 1.57 (major low).
2. Lower High Formation at 3.10–3.50
Repeated rejection here forms a lower high, increasing breakdown risk back to 2.55–2.30.
---
⚖️ Conclusion
QTUM is now at a critical decision zone. The Golden Pocket (2.55–2.77) will act as the “last defense” for bulls. If it holds, the bullish structure remains intact with upside potential toward 3.50–4.00+. If it breaks down, sellers could take back control and drag the price back into the old range.
> Note: Always wait for daily close confirmation before making trading decisions. This is technical analysis only, not financial advice.
#QTUM #QTUMUSDT #Crypto #Altcoins #PriceAction #TechnicalAnalysis #Breakout #SupportResistance #Fibonacci #CryptoTrading
QTUM Gaining momentumThe QTUM is in a strong trend and is moving forward with upward steps; pay attention to important levels.

$QTUM Jaw-Dropping Bullish Blast Shakes the Charts!BINANCE:QTUMUSDT
Price Levels (as marked on the chart):
SL (Stop Loss): 1.272 (3.651)
DCA (Dollar Cost Averaging): 1.135 (3.469)
Entry: 1.3 (3.290 - 3.270)
TP1 (Take Profit 1): 0.786 (3.006)
TP2 (Take Profit 2): 0.618 (2.783)
TP3 (Take Profit 3): 0.5 (2.627)
TP4 (Take Profit 4): 0.1963
Current Price: Approximately 3.290 - 3.270 (based on the right-side price scale)
RSI (Relative Strength Index): Shown at the bottom, indicating momentum. The RSI has recently risen to 79 - 78 , suggesting strong bullish momentum and potential overbought conditions.
Key Levels
The price has risen above the Entry level (1.3) and is currently below the DCA (1.135) and SL (1.272) levels when adjusted for the price scale (3.290 is above 3.270 entry). This indicates the trade is in profit, and the stop-loss has not been triggered.
It has surpassed TP1 (0.786) and is approaching TP2 (0.618) on the adjusted scale. The take-profit levels seem misaligned with the current price range, suggesting a possible scaling issue or typo in the chart annotations.
Support and Resistance: The sharp rise indicates strong buying pressure. The previous resistance around 2.90 (entry) has been broken, and the next resistance could be near the DCA level (3.469) if the uptrend continues.
RSI Analysis
The RSI at the bottom shows a significant upward trend, moving from a neutral region (around 50) to 79 - 78, indicating strong bullish momentum and potential overbought conditions as it nears 80.
The recent spike aligns with the price surge, confirming robust market interest, but the high RSI suggests a possible pullback or consolidation soon.
Trading Strategy Insights
Entry and Exit Points: The chart suggests a trading plan with an entry at 1 (3.290), a stop-loss at 1.272 (3.865), and take-profit levels (TP1 to TP4). The price has exceeded TP1, indicating profitability. However, the TP levels (e.g., 0.1963 for TP4) seem inconsistent with the current price range and may need correction.
Risk Management: The SL at 3.651 is above the current price (3.290 - 3.270), meaning the trade is secure. Adjusting the stop-loss to break even or above TP1 could lock in gains.
Potential Next Steps: If the uptrend persists, TP2 (2.783) is the next target. The high RSI (79 - 78) suggests caution for a potential reversal or pause, so traders should consider taking profits or waiting for confirmation.

QTUMUSDT Forming Descending ChannelQTUMUSDT is currently trading within a descending wedge pattern, which is generally considered a bullish reversal signal in technical analysis. The price action has been consolidating while forming lower highs and lower lows, but with decreasing momentum on the downside. This setup indicates that selling pressure is weakening and a potential breakout to the upside could be on the horizon. Based on the chart structure, a 40% to 50% upside move is expected once the wedge resistance is breached.
The trading volume supports this outlook, as steady participation from investors suggests accumulation rather than panic selling. This type of volume behavior is often seen before strong breakout rallies. The project is also beginning to attract increasing investor interest, which further strengthens the probability of a bullish move once technical confirmation is achieved.
For traders and investors, QTUMUSDT presents an opportunity to position ahead of a potential reversal. If the breakout occurs with strong momentum, the pair could quickly achieve the projected 40% to 50% gains. The descending wedge pattern, combined with favorable volume conditions, makes this setup worth watching closely for those looking to capture short to mid-term profits.
✅ Show your support by hitting the like button and
✅ Leaving a comment below! (What is You opinion about this Coin)
Your feedback and engagement keep me inspired to share more insightful market analysis with you!

QTUM/USDT – Make or Break? Testing the Edge of Accumulation?🧠 Overview:
After going through a volatile multi-year cycle, QTUM is now back at one of the most critical historical support zones. This demand area has acted as a strong reversal point multiple times since 2020 and is once again being tested as price consolidates near the bottom of its macro range.
---
📉 Price Structure & Key Levels:
📍 Major Support Zone (1.70 – 2.10 USDT):
A proven accumulation zone based on multiple long wicks and price rejections in the past.
This is where smart money tends to accumulate during market uncertainty.
📍 Layered Resistance Levels (Bullish Targets):
2.70 USDT → Initial breakout validation
3.53 USDT → Mid-range resistance
4.93 USDT → Key structural level
8.70 USDT → Mid-term breakout target
17.36 USDT → Peak from previous macro cycle
---
🧩 Current Pattern: "Sideways Accumulation Range"
QTUM is clearly in a range-bound accumulation phase, with tight price action within a key support area. Historically, such patterns often precede large impulsive moves, especially when accompanied by volume surges and breakouts from structure.
> ⚠️ Important Note: Sideways movement at historical support, combined with increasing accumulation volume, often leads to a breakout into the markup phase.
---
📈 Bullish Scenario: Potential Upside Momentum
Trigger: A confirmed breakout and weekly candle close above 2.70 USDT.
Additional Confirmation: Strong bullish candle with increased volume.
Targets:
3.53 USDT (local resistance)
4.93 USDT (mid-range structural level)
8.70 USDT (swing target)
17.36 USDT (macro cycle high)
🎯 High reward-to-risk potential if entries are made near support with a stop-loss under 1.70 USDT.
---
📉 Bearish Scenario: Breakdown Risk
Trigger: Weekly candle closes below 1.70 USDT.
Implication: Breakdown from long-term demand zone.
Downside Targets:
1.20 USDT → Minor horizontal support
0.71 USDT → Historical all-time low
Warning Sign: High volume breakdown = likely sign of institutional selloff or panic exit.
---
📊 Strategic Summary:
> QTUM is at a pivotal crossroads.
The 1.70 – 2.10 USDT range is a decisive area.
A bullish breakout could spark a major recovery rally,
while a breakdown may lead to a deeper capitulation.
This is a “calm before the storm” situation. Traders should monitor closely as the next few weekly candles could define the trend for the rest of 2025.
#QTUMUSDT #QTUM #CryptoAnalysis #AltcoinSetup #TechnicalAnalysis #AccumulationPhase #SupportAndResistance #BreakoutPlay #CryptoBreakout
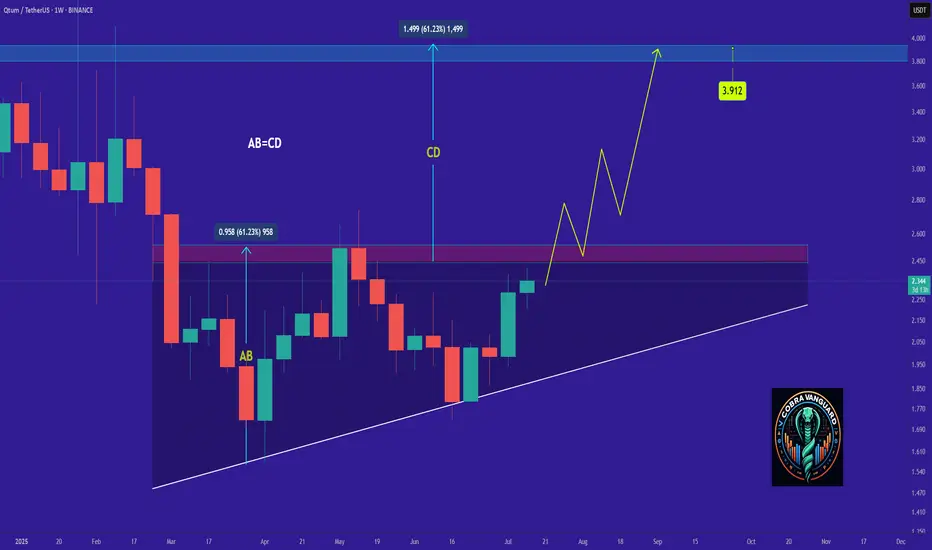
QTUM- Time to buy again!The price on the WEEKLY timeframe is within an ascending triangle, which can be promising. If the price breaks this pattern with bullish candles, it could easily rise by the distance of AB=CD.
Best regards CobraVanguard.💚
QTUMUSDT 1W AnalysisQTUM ~ 1W Analysis
#QTUM Buy back gradually from here with a short term target of at least 20%+ from this support.

#QTUM/USDT#QTUM
The price is moving within a descending channel on the 1-hour frame and is expected to break and continue upward.
We have a trend to stabilize above the 100 moving average once again.
We have a downtrend on the RSI indicator that supports the upward move with a breakout.
We have a support area at the lower limit of the channel at 2.25, acting as strong support from which the price can rebound.
Entry price: 2.30
First target: 2.35
Second target: 2.41
Third target: 2.47

QTUMUSDT 1D AnalysisQTUM ~ 1D Analysis
#QTUM Buy after successfully penetrating this resistant line with a short -term target of at least 10%+ from here.

QTUM May Surprise You All (3D Analysis)Qtum has formed a rectangle in weekly time period. Whenever it reachs the bottom, always turned back to gather upside liquidty till now.
The other interesting thing is, when Qtum first went upwards for liquidty, it took over 2 years to gather all remaining short liqudations. When it did again, it took less than a year. So the scale of time for gathering liquidty is squezing.
If Qtum can stay above the bottom of the rectangle, I believe there is a chance for %160 profit in long term. There is not even need for a leverage.
-%20 down here means that this coin is set for going hell and no way for recover.
But, there is %160 profit chance. The question is, are you willing to take that risk?
Cause I will.
Thanks for reading.
