RENDER / USDT – Trade ideaPrice is still trading inside a range after a strong sell-off.
Market shows indecision, but structure is holding for now.
This trade is already active, based on confluence with the Total Market Cap analysis.
Market conditions align with a potential relief move, as long as structure holds.
Technica
Related pairs

RENDERUSDT 1D#RENDER is testing the descending resistance on the daily chart. RSI and MACD indicate potential bullish momentum, so keep a close watch on #RENDER. If a breakout above the resistance occurs, the potential upside targets are:
🎯 $1.665
🎯 $1.966
🎯 $2.209
🎯 $2.451
🎯 $2.797
🎯 $3.238
⚠️ Always remember

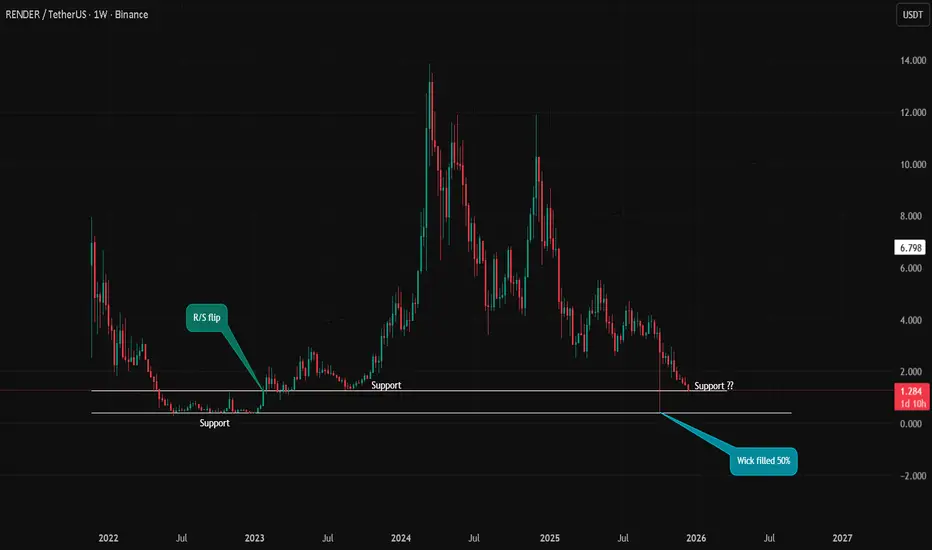
RNDR – Weekly Structure Price is currently trading at a major HTF support zone around $1.20–$1.30.
This level previously acted as strong support and resistance, making it a key decision area.
The recent downside wick has been partially filled (~50%), which often signals temporary demand, but structure is still bearish on
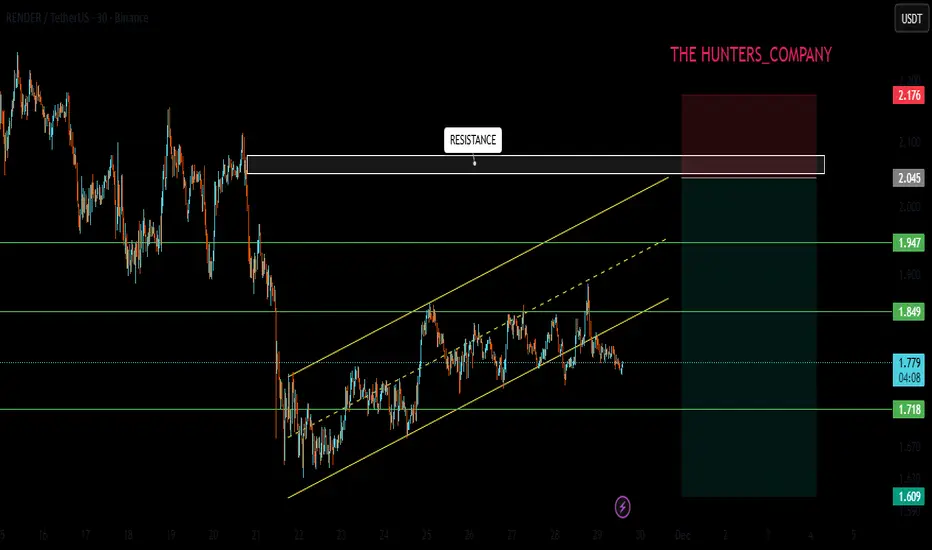
RENDER Analysis (4H)After sweeping a liquidity pool at the lows, price moved strongly to the upside and formed a bullish CH.
Now, on the pullback, we are looking for buy/long positions around the support zones.
I have two entry points, and the position should be built using DCA.
Targets are marked on the chart.
If

Long trade Pair RENDERUSDT
Buyside trade 2
Wed 27th Dec 25
6.00 am
Tokyo Session PM
Entry 1.276
Profit level 1.353 (6.03%)
Stop level 1.274 (0.15%)
RR 38.5
🧭 Market Context
We assume the market is operating within a rotational higher-timeframe environment, characterised by repeated liquidity runs and mean-

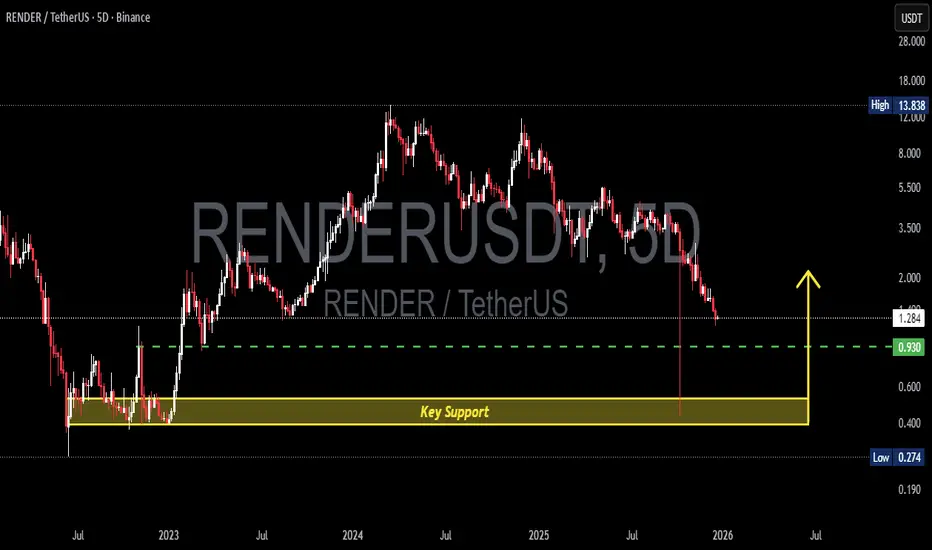
RENDER/USDT – Major Long-Term Support Test After Deep CorrectionRENDER/USDT on the 5-Day timeframe is currently in a strong bearish condition, following a prolonged distribution phase after failing to maintain a higher-high structure. Price has dropped aggressively and is now approaching a critical historical demand zone, highlighted by the yellow block at 0.52
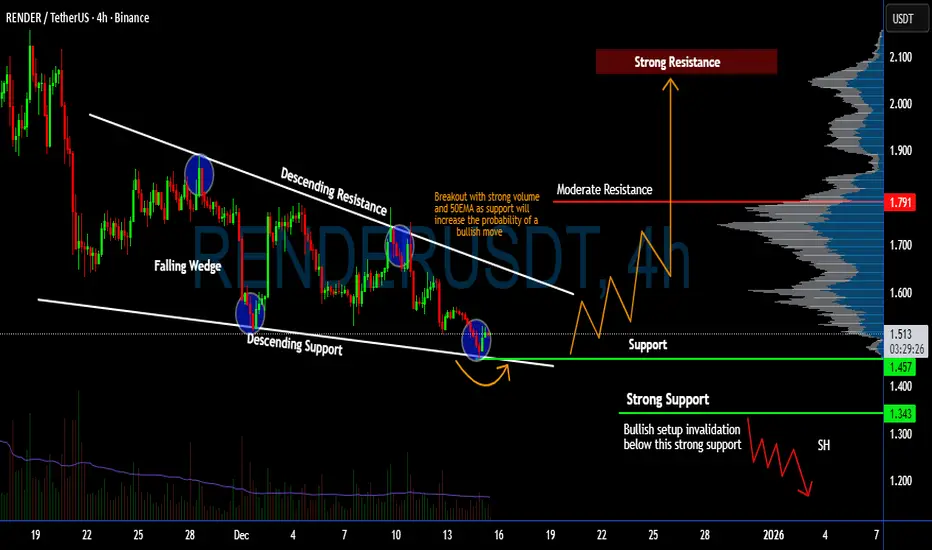
Will #RENDER Recover From Here or Not? Major Signs FlashingYello, Paradiser! Are you watching how #RENDERUSDT is respecting this falling wedge structure? Is a recovery on the horizon? Let's view the #Render setup:
💎#RENDERUSD is currently sitting right at the wedge's descending support after multiple rejections from the upper resistance trendline. Each tou
RENDER - Time to buy again!The price on the 4h timeframe is within an ascending triangle, which can be promising. If the price breaks this pattern with bullish candles, it could easily rise by the distance of AB=CD.

RENDER/USDT : SELL LIMITHello friends
Given the downward trend we are having, you can see that the power is in the hands of the sellers.
Now, if the price reaches the resistance areas, it is a good opportunity to sell. Be careful that if the structure breaks, it is no longer logical to sell.
So we should see the power
RENDERCRYPTOCAP:RENDER is trading inside a clean descending channel pattern and building pressure for a reversal. Once it breaks out, the measured target supports more than 800 percent in potential gains from the current price. This is a high conviction setup.

See all ideas
Summarizing what the indicators are suggesting.
Oscillators
Neutral
SellBuy
Strong sellStrong buy
Strong sellSellNeutralBuyStrong buy
Oscillators
Neutral
SellBuy
Strong sellStrong buy
Strong sellSellNeutralBuyStrong buy
Summary
Neutral
SellBuy
Strong sellStrong buy
Strong sellSellNeutralBuyStrong buy
Summary
Neutral
SellBuy
Strong sellStrong buy
Strong sellSellNeutralBuyStrong buy
Summary
Neutral
SellBuy
Strong sellStrong buy
Strong sellSellNeutralBuyStrong buy
Moving Averages
Neutral
SellBuy
Strong sellStrong buy
Strong sellSellNeutralBuyStrong buy
Moving Averages
Neutral
SellBuy
Strong sellStrong buy
Strong sellSellNeutralBuyStrong buy
Displays a symbol's price movements over previous years to identify recurring trends.
Frequently Asked Questions
The current price of RENDER / USDT (RENDER) is 1.300 USDT — it has fallen −1.21% in the past 24 hours. Try placing this info into the context by checking out what coins are also gaining and losing at the moment and seeing RENDER price chart.
RENDER / USDT price has risen by 2.59% over the last week, its month performance shows a −27.24% decrease, and as for the last year, RENDER / USDT has decreased by −81.00%. See more dynamics on RENDER price chart.
Keep track of coins' changes with our Crypto Coins Heatmap.
Keep track of coins' changes with our Crypto Coins Heatmap.
RENDER / USDT (RENDER) reached its highest price on Dec 5, 2024 — it amounted to 11.867 USDT. Find more insights on the RENDER price chart.
See the list of crypto gainers and choose what best fits your strategy.
See the list of crypto gainers and choose what best fits your strategy.
RENDER / USDT (RENDER) reached the lowest price of 0.533 USDT on Oct 10, 2025. View more RENDER / USDT dynamics on the price chart.
See the list of crypto losers to find unexpected opportunities.
See the list of crypto losers to find unexpected opportunities.
The safest choice when buying RENDER is to go to a well-known crypto exchange. Some of the popular names are Binance, Coinbase, Kraken. But you'll have to find a reliable broker and create an account first. You can trade RENDER right from TradingView charts — just choose a broker and connect to your account.
Crypto markets are famous for their volatility, so one should study all the available stats before adding crypto assets to their portfolio. Very often it's technical analysis that comes in handy. We prepared technical ratings for RENDER / USDT (RENDER): today its technical analysis shows the sell signal, and according to the 1 week rating RENDER shows the sell signal. And you'd better dig deeper and study 1 month rating too — it's sell. Find inspiration in RENDER / USDT trading ideas and keep track of what's moving crypto markets with our crypto news feed.
RENDER / USDT (RENDER) is just as reliable as any other crypto asset — this corner of the world market is highly volatile. Today, for instance, RENDER / USDT is estimated as 2.02% volatile. The only thing it means is that you must prepare and examine all available information before making a decision. And if you're not sure about RENDER / USDT, you can find more inspiration in our curated watchlists.
You can discuss RENDER / USDT (RENDER) with other users in our public chats, Minds or in the comments to Ideas.