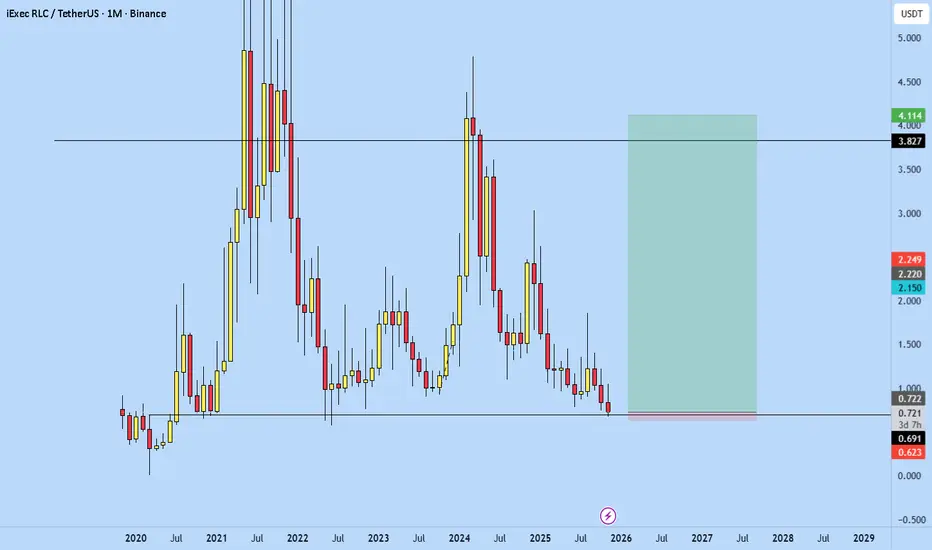
RLC preparing for an reversal?Simple, naked chart showing signs of potential flip back towards a new bullish cycle. If we can stay above that 0.7$ level, we can look at potential reversals back towards 3-4$.
From a Fundamental side of things, the project is promising and in undervalued territory. Let's see what next couple of
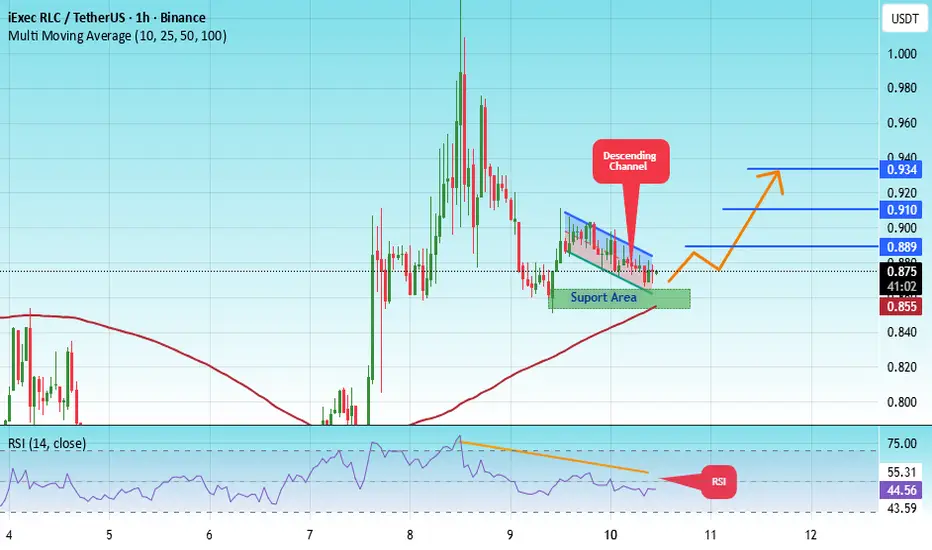
#RLC/USDT Pump Anticipated#RLC
The price is moving within an ascending channel on the 1-hour timeframe and is adhering to it well. It is poised to break out strongly and retest the channel.
We have a downtrend line on the RSI indicator that is about to break and retest, which supports the upward move.
There is a key suppo
RLCUSDT 3D#RLC is currently trading within a falling wedge pattern on the 3-day chart. Consider buying around the current level and near the support zone. In case of a breakout above the 3-day SMA50 and the wedge resistance, the potential upside targets are:
🎯 $1.059
🎯 $1.247
🎯 $1.543
🎯 $1.782
🎯 $2.020
🎯 $2.

RLC BREAKING OUTAI + DATA + PRIVACY = BULLISH...Also, Now Every private transaction or computation on Arbitrum requires RLC tokens, directly increasing demand. The integration positions RLC as a critical privacy infrastructure token, attracting speculative buying

RLC to All time High Possible???RLCusdt is providing a Good Spot entry for the upcoming weeks.
Possible rejection from here can send this massively to 5-7 and high chances of going into price Discovery after clearing 12-14 area.
Looks a very solid trade.
Setup is Buying DCA under 0.8800(current price).
Invalidation breaking belo

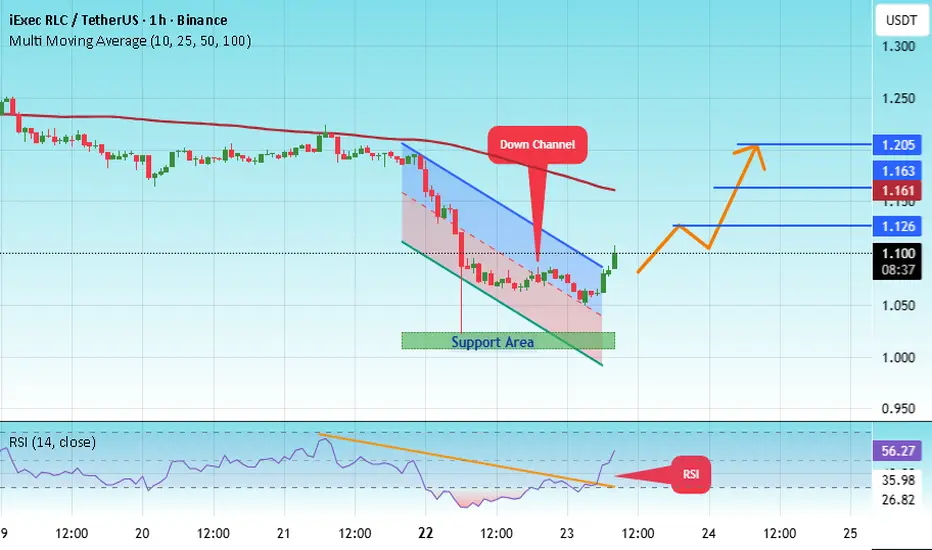
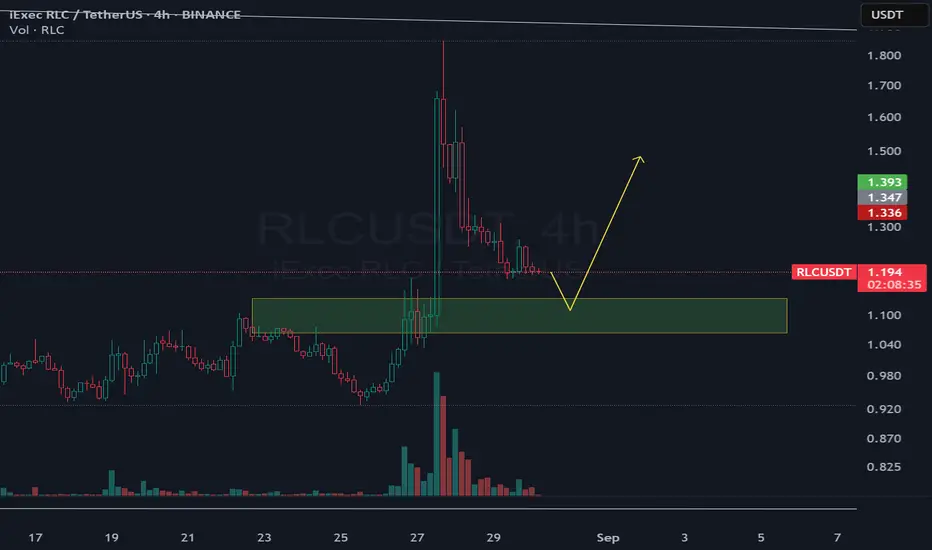
#RLC/USDT Pump Anticipated#RLC
The price is moving within a descending channel on the 1-hour frame, adhering well to it, and is heading for a strong breakout and retest.
We have a bearish trend on the RSI indicator that is about to be broken and retested, which supports the upward breakout.
There is a major support area i
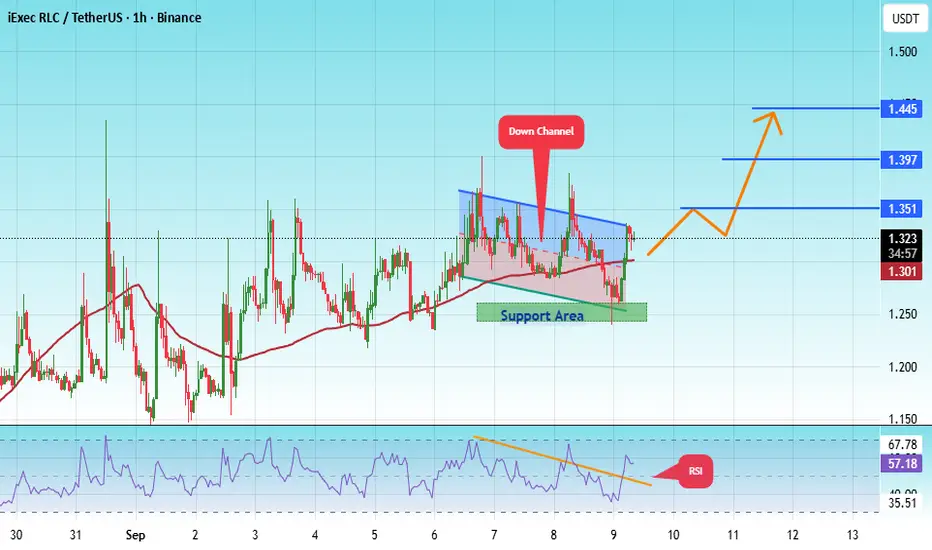
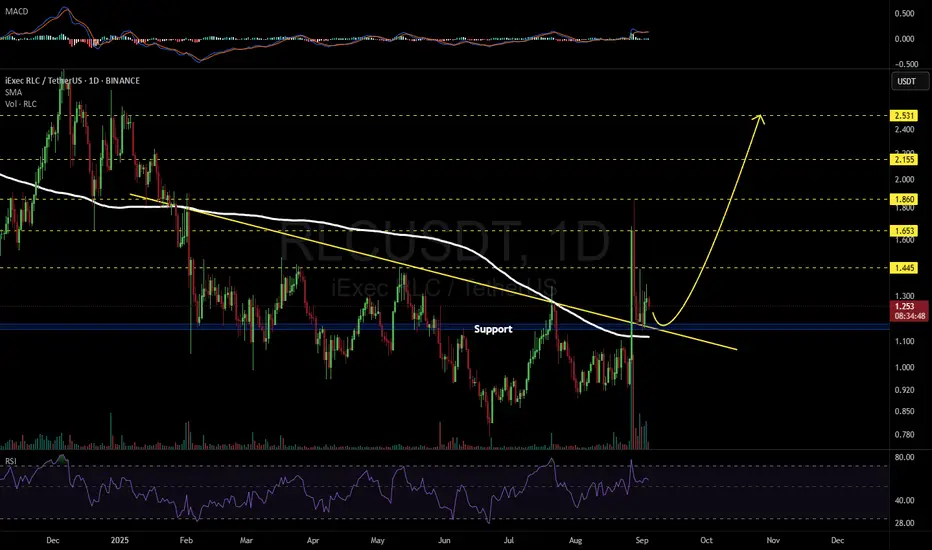
RLCUSDT 1D#RLC, after its strong rally, is still in a corrective phase and is expected to retest the descending support line. In case of a successful bounce, the potential targets are:
🎯 $1.445
🎯 $1.653
🎯 $1.860
🎯 $2.155
🎯 $2.531
⚠️ Always remember to use a tight stop-loss and follow proper risk management.
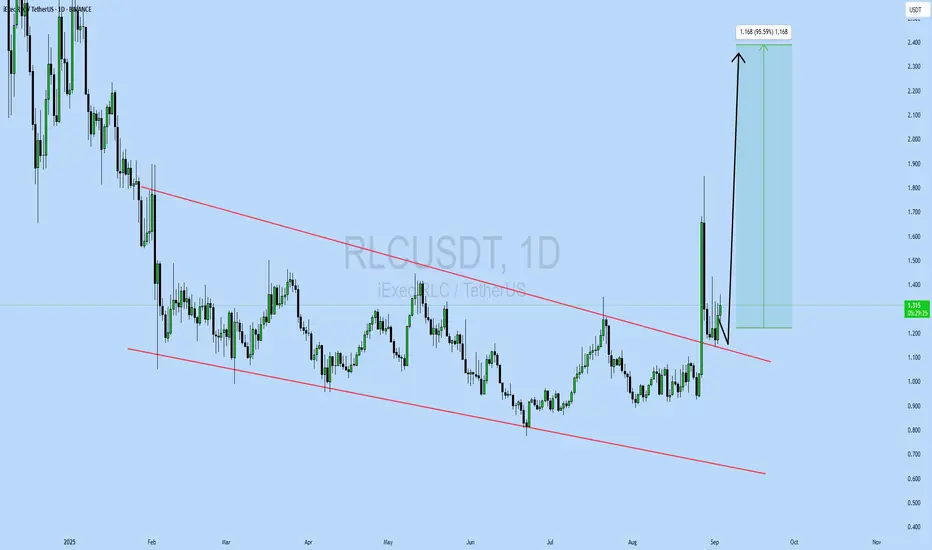
RLCUSDT UPDATE#RLC
UPDATE
RLC Technical Setup
Pattern : Falling Wedge Pattern
Current Price: $1.316
Target Price: $2.48
Target % Gain: 95.59%
Technical Analysis: RLC has broken out of a falling wedge on the 1D chart with a strong bullish candle. Volume spike confirms buying pressure, suggesting momentum could
See all ideas
Summarizing what the indicators are suggesting.
Oscillators
Neutral
SellBuy
Strong sellStrong buy
Strong sellSellNeutralBuyStrong buy
Oscillators
Neutral
SellBuy
Strong sellStrong buy
Strong sellSellNeutralBuyStrong buy
Summary
Neutral
SellBuy
Strong sellStrong buy
Strong sellSellNeutralBuyStrong buy
Summary
Neutral
SellBuy
Strong sellStrong buy
Strong sellSellNeutralBuyStrong buy
Summary
Neutral
SellBuy
Strong sellStrong buy
Strong sellSellNeutralBuyStrong buy
Moving Averages
Neutral
SellBuy
Strong sellStrong buy
Strong sellSellNeutralBuyStrong buy
Moving Averages
Neutral
SellBuy
Strong sellStrong buy
Strong sellSellNeutralBuyStrong buy
Displays a symbol's price movements over previous years to identify recurring trends.