RUNE - oversold! will it hold? I don’t see any significant negative shift in fundamentals — if anything, I sense a possible fundamental strengthening for THORChain. The first blue line (price above roughly $2) remains my minimum target. Given the weekly RSI levels are historically this oversold (on Binance), a bounce to the first target looks plausible. If momentum returns, a second target around $4 also seems within reach.
Fundamental Strength — Why RUNE / THORChain could support higher targets
Here are the main reasons why fundamentals might back a bullish move:
Key utility token for a fully decentralized cross-chain swap network. RUNE is not just another “token,” but the settlement asset for all liquidity pools on THORChain — every asset that sits in THORChain’s pools is paired 1:1 with RUNE. That means every swap fundamentally requires RUNE, creating structural demand as long as usage grows.
Security and network bonding increase demand — not just trading demand. Validators (node operators) must bond RUNE (often 2× the amount pooled) to secure the network. As activity, liquidity or total value locked on THORChain increases, the amount of RUNE needed for bonding rises — which can lead to upward pressure on RUNE’s price.
Multi-chain, permissionless cross-chain liquidity — well positioned in DeFi infrastructure. THORChain enables native asset swaps across different blockchains without wrapped tokens or centralized intermediaries, which is a unique and attractive value proposition in DeFi. As cross-chain demand and adoption grows, RUNE’s role becomes more central.
Tokenomics offer a clean setup. Circulating supply of RUNE is ~ 350 M (with total supply on protocol docs roughly ~425 M — though supply mechanisms may evolve).
Because RUNE is required for all swaps / liquidity / staking / governance / security, its demand isn’t merely speculative — it’s functional.
Given that structure, a rally — especially after deep oversold pressure — could very well be underpinned by real utility demand, not just speculative interest. That aligns with your bullish target zones.
Trade ideas

RUNEUSDT 1D#RUNE is currently trading within a descending channel on the daily chart and is sitting on a strong support zone. For the bullish scenario to remain valid, it must hold above this level. In case of a breakout above the channel resistance, the potential upside targets are:
🎯 $1.061
🎯 $1.267
🎯 $1.433
🎯 $1.599
🎯 $1.836
🎯 $2.137
⚠️ Always use a tight stop-loss and maintain proper risk management.

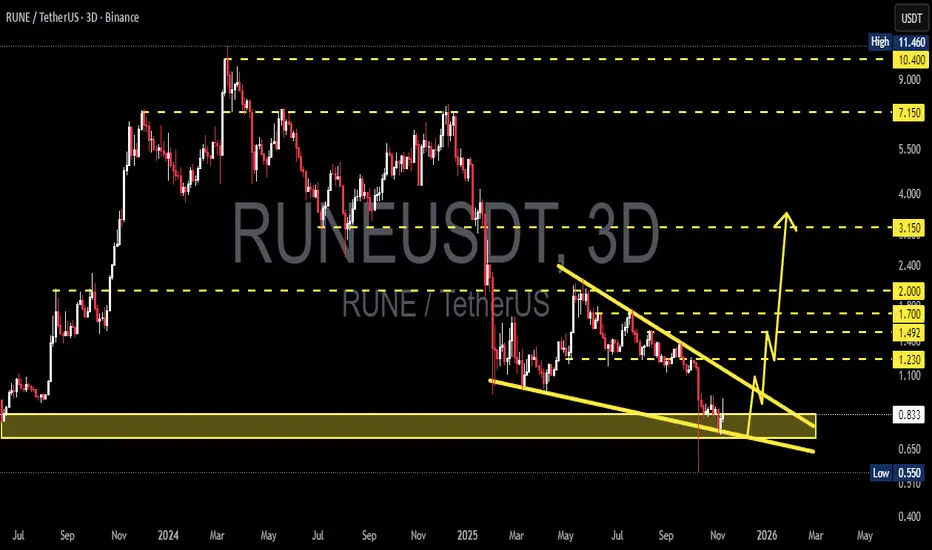
RUNE/USDT — Reversal Incoming or Breakdown Ahead?After a prolonged downtrend from the peak around $11.46, RUNE/USDT has now returned to the golden zone ($0.70–$0.833) — a major historical support area that once served as the launchpad for a massive rally.
The price structure reveals a Falling Wedge pattern, a classic formation that often signals a potential trend reversal after a phase of exhaustion and distribution.
However, despite this bullish potential, the market remains at a crucial inflection point — where every candle in this zone could mark the beginning of a strong rebound... or the confirmation of a deeper breakdown to new lows.
---
Pattern & Structure Details
Main Pattern: Falling Wedge / Descending Channel
The narrowing trendlines indicate weakening selling pressure and potential for trend exhaustion.
Major Support Zone: $0.70 – $0.833, a strong demand area that has acted as a key pivot since mid-2023.
Key Resistance Levels (potential targets):
R1: $1.23
R2: $1.49 – $1.70
R3: $2.00 – $3.15
Critical Low: $0.55 → a break below this level could open further downside towards $0.40 or even $0.30.
---
Bullish Scenario (Potential Major Reversal)
If price holds above $0.70–$0.833 and then breaks out above the wedge trendline, it could confirm a strong reversal signal.
A 3D bullish candle with rising volume would serve as a powerful confirmation for a trend change.
Step-by-step upside targets:
T1: $1.23 → Initial resistance and short-term profit-taking zone.
T2: $1.49 – $1.70 → Mid-term reaction area.
T3: $2.00 – $3.15 → High-confidence target zone if a new bullish trend forms.
A valid breakout in this area could mark the end of the capitulation phase and the beginning of a new accumulation phase, similar to previous pre-rally setups.
---
Bearish Scenario (Final Breakdown Before Recovery)
If the $0.70 zone fails to hold and a 3D candle closes below it, the wedge structure will lose strength, opening downside continuation targets at:
$0.55 (previous low) as the first support,
followed by $0.40 – $0.30 if heavy selling continues.
However, beware of fake breakdowns (false breaks) followed by rapid recoveries — these often act as bear traps before a major bullish reversal.
---
Analysis Summary
📊 RUNE is standing at a major decision point.
The $0.70–$0.833 zone is the last line of defense — if it holds, a wedge breakout could ignite a new bullish leg. If it fails, the market may seek new lows before establishing a real bottom.
This moment will determine whether we’re witnessing smart money accumulation or the final phase of capitulation before the next market cycle begins.
#RUNE #RUNEUSDT #CryptoAnalysis #AltcoinWatch #FallingWedge #CryptoSetup #SupportZone #BullishScenario #BearishScenario #MarketDecision #CryptoTA #SwingTrade #TechnicalAnalysis
Rune Breakout Coming | RUNEUSDTThe upcoming week for all Altcoins are crucial especially for RUNEUSDT. A Bullish Wedge is forming making it a Perfect Position for Long for easy 10-15% Profit in Spot.

Rune Thor Chain Saatnya DCAI used the latest market data and key events: a price of around $1.18–$1.27 and a circulating supply of ~351.3 million RUNE. THORChain is also dealing with a debt issue of ~$200 million (planned conversion to equity tokens/restructuring) that impacts risk and liquidity.
Basic assumptions (used in calculations):
Circulating supply (≈) = 351,300,000 RUNE.
The current benchmark price is estimated at $1.27 (an example for calculating the current market cap).
There are solvency/restructuring issues (≈ $200 million in debt) that increase short-term uncertainty.
Conversion example — current market cap (illustration):
351,300,000 × $1.27 = 351,300,000 + (351,300,000 × 0.27)
351,300,000 × 0.27 = 94,851,000
⇒ market cap ≈ $446,151,000. (Check price and supply sources for rounding).
---
Price projection (3 scenarios)
> Note: I also include an implied market cap for each target = target price × 351,300,000.
1) Optimistic Scenario (adoption + reputation recovery)
Trigger assumptions: successful debt conversion without harming RUNE holders, increased integrations and swap volume, restored trust, surge in TVL and LP.
Price Target (12–36 months): $8 – $20
Implied market cap $8 → 351,300,000 × 8 = $2,810,400,000.
Implied market cap $20 → 351,300,000 × 20 = $7,026,000,000.
Probability (subjective): ~15–25% (needs many positive things to happen).
Short Rationale: RUNE could be valued as critical cross-chain infrastructure if swap volume and TVL grow rapidly.
2) Moderate Scenario (slow recovery/stability)
Assumptions: restructuring is underway, services are gradually restored, volumes are slowly increasing, but regulation and competition remain pressing.
Price Target (12–36 months): $2 – $6
Implied market cap $2 → $702,600,000.
Implied market cap $6 → $2,107,800,000.
Probability: ~45–60%.
Rationale: Consumers and LPs gradually returning; the token is still far from its ATH, with room for upside if solvency issues don't destroy trust.
3) Pessimistic Scenario (loss of trust/regulation/liquidity)
Assumptions: The restructuring fails or is highly detrimental to token holders, strict regulation, or a security incident/large LP withdrawal.
Price target (6–24 months): $0.30 – $1.00 (or lower)
Implied market cap $0.30 → 351,300,000 × 0.30 = $105,390,000.
Implied market cap $1.00 → $351,300,000.
Probability: ~20–35%.
Rationale: Solvency and reputation issues could drive liquidity outflows.
(Market data sources and restructuring/delay events: CoinGecko, CoinMarketCap, Cointelegraph, Messari — see news summary on servicing whales and $200M debt conversion plan).
---
Practical recommendations/risk management rules
1. Position sizing (conservative advice): No more than 1–3% of total investment portfolio for speculative allocations like RUNE; If aggressive, limit to a maximum of 5%.
2. Logical entry points (based on a moderate scenario): buy incrementally in the $0.8–$1.8 range (dollar-cost averaging).
3. Stop-loss & take-profit: Conservative example — initial stop-loss 30–50% of entry price (depending on tolerance), gradual take-profit targets depending on the scenario (e.g., sell partially at $2–$6, then sell again at $8+).
4. Checkpoints (should be monitored weekly/monthly):
Updates on $200M debt conversion & governance decisions.
Total swap volume & 24-hour spot volume (rising indicates adoption).
Total RUNE pooled / TVL & number of active validator nodes (determines security & liquidity).
Legal/regulatory news and security audits.
---
What can I build next (immediately)
Pick one and I'll work on it now:
1. Create a numerical projection model (simple Monte-Carlo or deterministic scenario) that generates a probability curve and estimated date (I'm assuming supply and volume).
2. A concise dashboard (table) showing target price → implied market cap → % increase from current price.
3. A news and metrics notification checklist (a checklist format that you can monitor weekly).

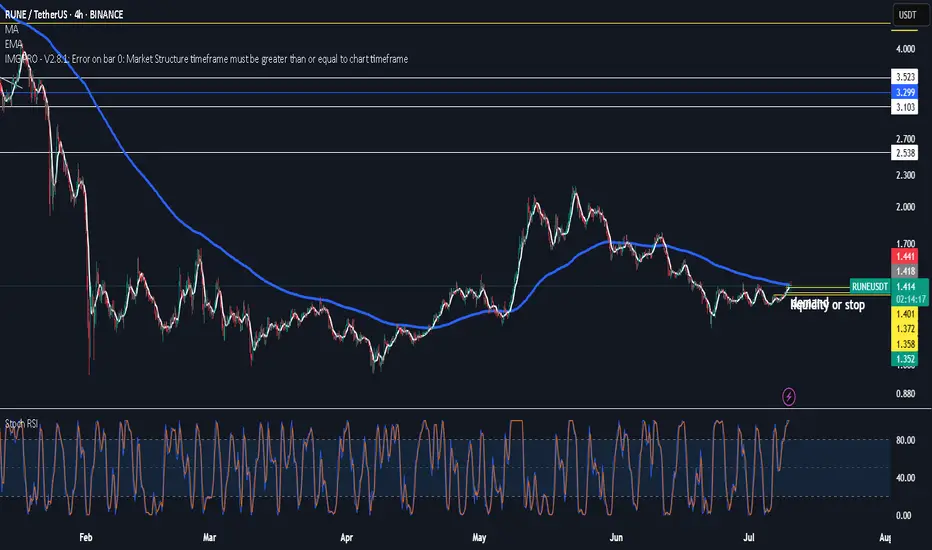
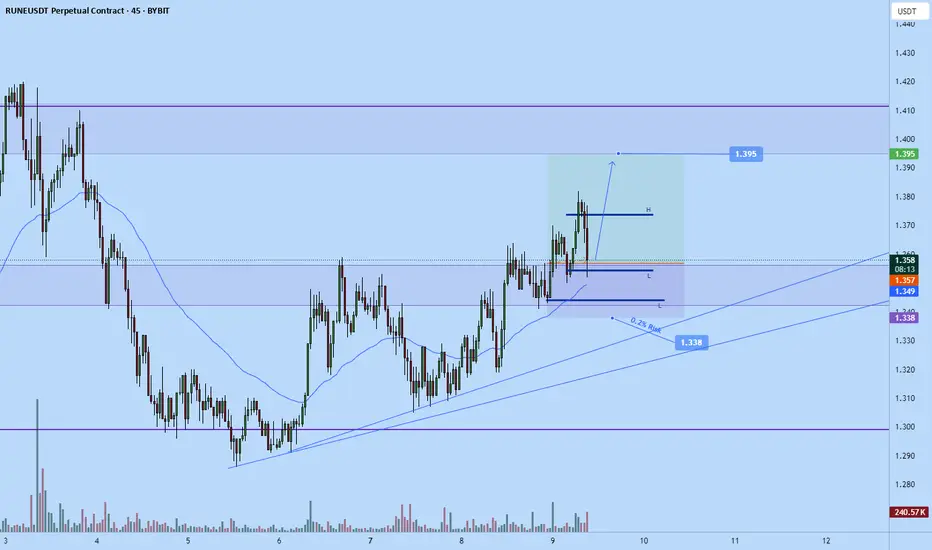
RUNE break through the downtrendIdeally we would want to close in the 1.375-1.400 area to confirm a breakout from the downtrend. If we fail to do this, we should expect a further downtrend. Next few days are critical, but with the rather bullish sentiment on other assets I remain optimistic.

#RUNEUSDT 4H ChartPrice retested the 200MA where it got rejected from. MACD is starting to show some bullish weakness, RSI is still bought and EMAs are neutral. If price breaks below the 100MA, then we would expect it to keep retracing until the 4h demand zone at around $1.18.

rune usdt long"The coin RUN has formed a Head and Shoulders pattern on the 4H timeframe. After breaking the 1.225 level, it may move upward."
"Risk management and money management are the keys to being a profitable trader."

Runeusdt Buy opportunityRUNEUSDT exhibits a potential symmetrical triangle formation, with price accumulating near the lower boundary of the pattern within a key external demand zone. The structure suggests a consolidation phase, with a breakout from this range likely to dictate the next major move.
A bullish expansion from this level could drive RUNE toward the main supply zone around $7.25, aligning with previous structural rejections and the descending trendline resistance. A breakout above this zone would confirm bullish momentum, targeting the $20.40 high.
However, failure to maintain support within the demand zone may expose RUNE to further downside, with key support around $2.55

RUNEUSDT BULLISH SETUPI THINK THAT rune is so near to finish wxy correction in w 2/b and then going up to 2$ in w c/3
i hope that you like the analysis


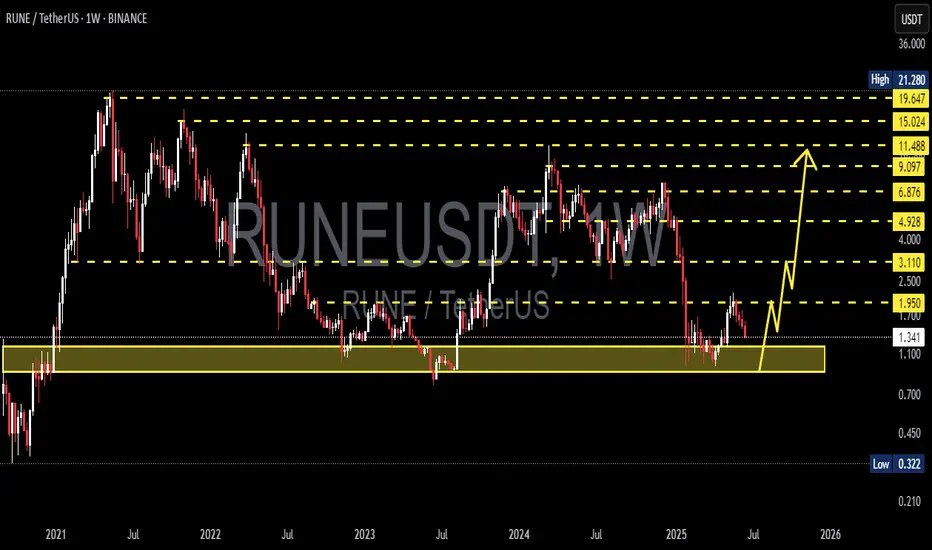
RUNE/USDT — Major Weekly Support Retest: Bounce or Breakdown?📊 RUNE/USDT Weekly Analysis
RUNE/USDT is now trading at a critical decision point. Price is hovering around $1.22, right inside the multi-year support zone of $0.90 – $1.35 (yellow box). This demand zone has been tested multiple times since 2022, each time preventing further breakdowns and sparking rebounds.
If this zone holds again, we could see one of the strongest reversal rallies in recent years. But if it breaks, there’s still a wide gap to the downside, with the historical low at $0.32 acting as the next major support.
---
🔎 Market Structure & Pattern
1. Demand Base (Yellow Zone)
Price has repeatedly returned to $0.90 – $1.35, showing strong historical demand.
This zone is the “last line of defense” for buyers.
2. Sideways Range
Since 2023, RUNE has been consolidating between ~$1.00 – $2.00, indicating accumulation and distribution.
3. Potential Bullish Pattern
If support holds → possible double/triple bottom formation on the weekly timeframe, setting up a new bullish cycle.
4. Bearish Risk
A clean weekly breakdown below $0.90 would erase demand, opening the door to $0.55 → $0.39 → $0.32.
---
🚀 Bullish Scenario
Confirmation: Weekly close above $1.95 (first key resistance).
Upside targets:
$3.11 (+154%)
$4.93 (+303%)
$6.87 (+462%)
$9.09 → $11.48 → $15–21 (historical resistances).
Strategy: Scale into support zone, add more after a confirmed breakout above $1.95, stop below $0.90.
---
⚠️ Bearish Scenario
Trigger: Weekly close below $0.90.
Downside targets:
$0.55 → $0.39 → $0.32 (historical low).
Risk: ~−73.6% from current price.
Strategy: Avoid averaging down without reversal signals. Short/hedge only after confirmed breakdown.
---
🎯 Key Takeaway
$0.90 – $1.35 = the final battlefield for buyers.
Holding this base could spark a massive reversal rally.
Losing it could send RUNE into uncharted lows.
Right now, RUNE is at a make-or-break moment:
➡️ Building a foundation for the next altseason rally,
or
➡️ Collapsing into its historical bottom.
#RUNE #RUNEUSDT #Crypto #Altcoins #TechnicalAnalysis #SupportResistance #CryptoTrading #SwingTrade #CryptoChart #PriceAction

RUNE BIG PUMP is comingDear Traders,
expect rune to explode in price very soon this what i see on the chart based on technical analysis
lets see how this can play

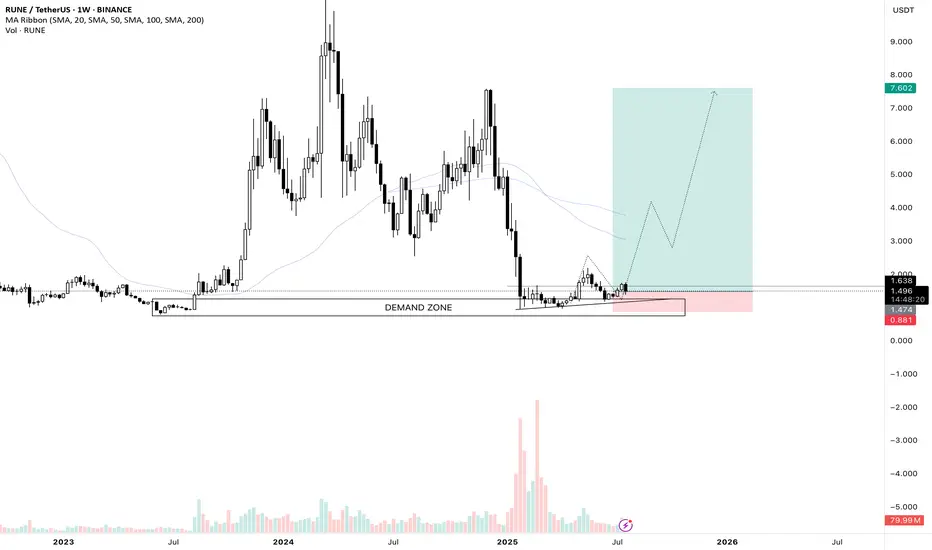
THORChain Prepares New Bullish Wave · Trades at Bottom PricesLook at the period between June 2022 and October 2023. This is literally what we call "bottom prices," and this is exactly what we have now.
In this case, RUNEUSDT, the period starts January 2025 until this present day. THORChain is trading at bottom prices. The best time to buy before a major bullish wave.
Look back to October 2023, after a very strong and prolonged sideways period, the market turned extremely bullish, this is the exact same pattern we will have again. After months and months of sideways, the market will recover and turn, producing a new trend, an uptrend.
In late 2020, also around October, there was another consolidation period at bottom prices before a major rise. So this happens all the time. THORChain goes up and then hits bottom. Once at the bottom it lingers there for a while finally to recover and become super bullish. Each bullish period lasts anywhere between 6-12 months. Can be more or less depending on when you start to come but the project has been proven to move wild and big when the bulls are in. Which is what comes next.
Do not be deceived by the low prices or the short-term, everything can change in an instant and you already saw the preview, you already saw what is possible and to this market phase we are getting close. We are getting close to the next bullish wave and this wave will produce marketwide growth. Many more pairs will move compared to previous cycles and the advance will last that much longer.
It is already happening. The low was hit in January, almost 8 months ago. We are about to move higher, the highest prices since 2021.
Namaste.

RUNE at the Brink: Rebound Opportunity or Breakdown Incoming?🧩 Overview:
RUNE/USDT is currently hovering at a critical support zone — a historical demand area that has triggered strong bullish rallies in the past. Positioned between $1.00–$1.30, this level has been a battle ground between buyers and sellers. The big question now: Will RUNE bounce for a bullish reversal or break down into deeper lows?
---
🔍 Key Levels Identified:
Major Support Zone (Demand Area): $1.00 – $1.30 (yellow box)
Immediate Resistance: $1.95 → $3.11 → $4.92
Extended Bullish Targets: $6.87 → $9.09 → $11.48 → $15.02
Deeper Bearish Targets (if support fails): $0.80 → $0.55 → $0.32
---
🟢 Bullish Scenario (Recovery Rally):
📌 Key Signal: Strong hold and price reaction above the $1.00–$1.30 zone.
1. Reversal Patterns: Look for double bottom, bullish engulfing, or strong weekly pin bars to signal a potential reversal.
2. Momentum Confirmation: A breakout above $1.95 with high volume could trigger a strong continuation to $3.11 and $4.92.
3. Macro Tailwinds: A broader recovery in Bitcoin and the crypto market could enhance bullish pressure on altcoins like RUNE.
🎯 Mid to Long-Term Bullish Targets:
$3.11 → $4.92 → $6.87+
Potential upside of 200–400%+ from current levels if bullish structure confirms.
---
🔴 Bearish Scenario (Breakdown):
📌 Critical Risk: Weekly candle close below $1.00 with volume confirmation.
1. Support Breakdown: If $1.00 fails, price may revisit previous lows around $0.80 or even test historical demand levels at $0.32.
2. Bearish Continuation Pattern: Sustained lower highs and lower lows suggest downtrend continuation unless invalidated.
3. Volume Pressure: Heavy sell volume on breakdowns reinforces bearish bias.
⚠️ Bearish Targets: $0.80 → $0.55 → $0.322 (historical low)
---
🔄 Pattern & Structure:
Historical Accumulation Zone: The yellow box has been a long-term accumulation area since 2021.
Repeat Behavior: Previous touches to this zone sparked multi-week rallies.
Potential Wyckoff Accumulation: If price forms a sideways range with rising lows, this may be the early stage of a markup phase.
---
🧠 Strategic Outlook for Traders:
✅ Bullish Strategy:
Conservative entry: Wait for breakout + retest of $1.95
Aggressive entry: Accumulate within $1.00–$1.30 zone with tight stop below $0.98
❌ Bearish Strategy:
Short setup on confirmed breakdown below $0.98
Avoid trading without confirmation of direction (no FOMO)
---
🚀 Conclusion:
RUNE is standing at a make-or-break level — a tipping point between a bullish breakout or further bearish pressure. Smart traders don't just predict direction; they prepare for both outcomes. This is not just a technical zone — it's the market’s decision point.
#RUNE #RUNEUSDT #CryptoAnalysis #AltcoinWatch #BreakoutSetup #DemandZone #TechnicalAnalysis #CryptoOutlook #BullishScenario #BearishScenario #Wyckoff

RUNE : Ready to pump?Hello friends🙌
👀According to the price drop, you can see that the price has reached an important area, which, according to the pattern formed, if the specified resistance is broken, we can enter with risk and capital management and move to the specified targets.
🔥Follow us for more signals🔥
*Trade safely with us*

RUNE/USDT Weekly swing set upI love this chart and I entered a long trade on futures. After a sharp decline of the price we are retesting a huge weekly demand zone, we saw the volume really spike up on this area. If Ethereum continues its run which I believe so, I think Rune could really perform well. It is a swing trade so I am going to keep this position open for a few months and see how it develops.
Like and share guys and leave your thoughts on the comment section!
See you on the next one.
RUNE (Y25.P2.E1).Looking to short the macroHi Traders,
RUNE has some more highs to do, however based on the structure, I would not bet it will go much. My interests is finding that trade to short when it comes to Alt coins.
With my TA approach, Wave 5 might just equal Wave 1 length. Along with some confluences of FVP levels, we might just get this right. Time will time.
All the best,
Regards, S.SAri

Rune long to $1.645Time sensitive
Just went long on rune
Stop: $1.527
Tp1: $1.59
Tp2: $1.645
DTT setup

THORChain 1,784% Profits Potential & Technical AnalysisHere we can see THORChain sandwiched in-between EMA89 and EMA55. The action is not happening above EMA89 but this shouldn't be considered bearish, more like "we are not there yet." Or, "still consolidating but with a bullish bias."
The bias is bullish because the low came in early February 2025. So that is more than 5 months ago. A bearish trend or bearish continuation would require lower lows in those 5 months. The fact that after the low in February there was a small recovery and this recovery ended as a higher low on the retrace, means the downtrend reached its end. Since the downtrend is over, we are seeing consolidation, accumulation before the market turns. The turning is the bullish cycle, the uptrend. And we are in the process of seeing this change materialize into the market, price and chart.
The minimum target is the "baseline level" between $7.44 and $6.20. The target to aim for should be $18 and if you are feeling optimistic then $28. I've seen this project grow incredibly strong in the past so I wouldn't be surprised if it ends up moving even higher.
This is a simple chart. What goes down, must come back up; specially when we are talking about Crypto. The best financial market in the whole world. Young, but highly profitable. Risky? I don't know... It is risky to be young. But the potential rewards make up for any risk the market carries. We can take risk when we are young. We should. You play it safe because you are old. No risk, no fun. Plan ahead, success is yours.
Namaste.

$rune- $2.58reclaim of 200 ema on H4
pop
retest
liquidity under 200 ema
then golden cross
send to valhalla
another 2hrs watching for reclaim
RUNEUSDT 1W AnalysisRUNE ~ 1W Analysis
#RUNE Buy back gradually from here with a short term target of at least 20%+ from this support block.