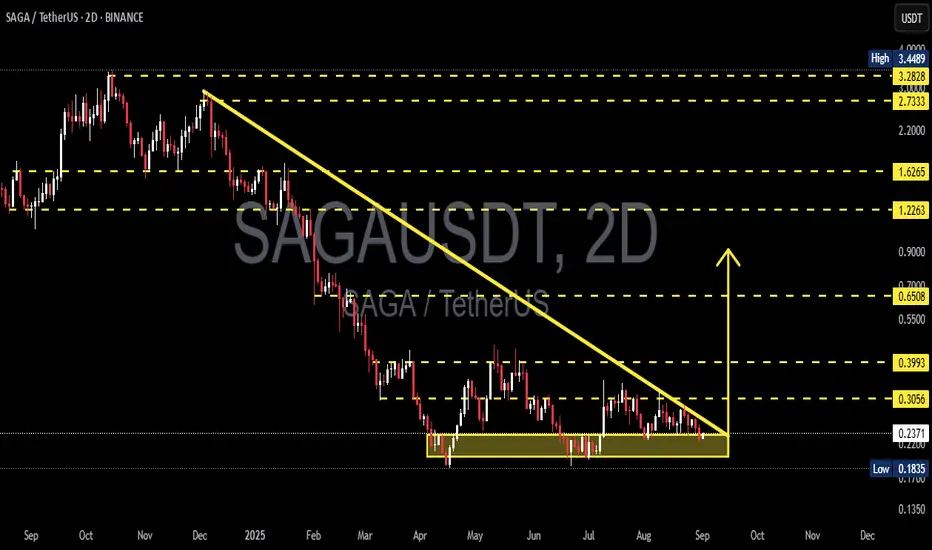
SAGA/USDT - Market StructureSAGA remains in a persistent downtrend.
During the flash crash, price lost its support and is now trading roughly –65% below it.
There is a chance this deviation gets filled:
— a clear bullish divergence has formed on RSI,
— on the weekly RSI, price is sitting at levels that previously produced a ~
Related pairs

Risk in Global Events and Geopolitical News1. Understanding Geopolitical Risk
Geopolitical risk is fundamentally tied to countries, governments, conflict, policy, and global relationships. It involves evaluating how political decisions or international disputes may impact economic conditions.
Common sources of geopolitical risk include:
W

SAGAUSDT Forming Falling WedgeSAGA/USDT is developing a classic falling-wedge formation, signaling that downside pressure may be easing and a bullish reversal could be near. The compression in price — with lower highs slowly tightening — suggests that sellers are running out of steam, while buyers may be building a base. Volume

SAGAUSDT 1D#SAGA is moving inside a falling wedge pattern on the daily chart. For the bullish scenario to play out, it must bounce from the wedge support line and break above the pattern. So, wait for a solid breakout before entering this coin. If that happens, the potential targets are:
🎯 $0.1992
🎯 $0.2620
🎯

SAGAUSDT - Has a great potential to give you 18% profitSAGAUSDT : Our analysis suggests this trading pair has a strong potential for an upside move, targeting a profit of 18%. This presents an excellent short-term opportunity for traders looking to capitalize on the current market momentum.

Saga = 2025 version of AAVE?
Back in 2020, very few people paid attention to $LEND.
Then it rebranded to EURONEXT:AAVE , and in Q4 2020 the real run began:
📈 from $0.40 → $600+ in less than a year.
Fast forward to today:
• Rebecca (Saga co-founder) just confirmed their DeFi layer is being built with ideas similar to AAVE’s

SAGA - 50%+ bullish wave awaited!LSE:SAGA - Daily view looks ready for a 50%+ move 📈
Patience is key.

SAGAUSDT — Descending Triangle: Preparing for a Major Move?📌 Market Context
On the 2D timeframe, SAGA/USDT has been in a prolonged downtrend since late 2024 into early 2025. Recently, price action has formed a descending triangle: consistent lower highs pressing down against a flat demand zone at 0.22–0.24.
This structure reflects seller dominance (lower
SAGAUSDT 1D#SAGA is moving inside a symmetrical triangle on the daily chart. Consider buying some #SAGA at the current price and near the support level of $0.2493.
In case of a breakout, the potential targets are:
🎯 $0.3206
🎯 $0.3525
🎯 $0.3978
🎯 $0.4556
⚠️ As always, use a tight stop-loss and apply proper r

SAGAUSDTLets gooooo!!!! high and higher.Just focus on the manipulation in market weekly and daily and you will understand the secret of marker :) Good luck!!

See all ideas
Summarizing what the indicators are suggesting.
Oscillators
Neutral
SellBuy
Strong sellStrong buy
Strong sellSellNeutralBuyStrong buy
Oscillators
Neutral
SellBuy
Strong sellStrong buy
Strong sellSellNeutralBuyStrong buy
Summary
Neutral
SellBuy
Strong sellStrong buy
Strong sellSellNeutralBuyStrong buy
Summary
Neutral
SellBuy
Strong sellStrong buy
Strong sellSellNeutralBuyStrong buy
Summary
Neutral
SellBuy
Strong sellStrong buy
Strong sellSellNeutralBuyStrong buy
Moving Averages
Neutral
SellBuy
Strong sellStrong buy
Strong sellSellNeutralBuyStrong buy
Moving Averages
Neutral
SellBuy
Strong sellStrong buy
Strong sellSellNeutralBuyStrong buy
Displays a symbol's price movements over previous years to identify recurring trends.
Frequently Asked Questions
The current price of SAGA / USDT Spot Trading Pair (SAGA) is 0.0614 USDT — it has fallen −2.37% in the past 24 hours. Try placing this info into the context by checking out what coins are also gaining and losing at the moment and seeing SAGA price chart.
SAGA / USDT Spot Trading Pair price has fallen by −15.60% over the last week, its month performance shows a −24.57% decrease, and as for the last year, SAGA / USDT Spot Trading Pair has decreased by −96.92%. See more dynamics on SAGA price chart.
Keep track of coins' changes with our Crypto Coins Heatmap.
Keep track of coins' changes with our Crypto Coins Heatmap.
SAGA / USDT Spot Trading Pair (SAGA) reached its highest price on Apr 9, 2024 — it amounted to 7.9010 USDT. Find more insights on the SAGA price chart.
See the list of crypto gainers and choose what best fits your strategy.
See the list of crypto gainers and choose what best fits your strategy.
SAGA / USDT Spot Trading Pair (SAGA) reached the lowest price of 0.0454 USDT on Oct 10, 2025. View more SAGA / USDT Spot Trading Pair dynamics on the price chart.
See the list of crypto losers to find unexpected opportunities.
See the list of crypto losers to find unexpected opportunities.
The safest choice when buying SAGA is to go to a well-known crypto exchange. Some of the popular names are Binance, Coinbase, Kraken. But you'll have to find a reliable broker and create an account first. You can trade SAGA right from TradingView charts — just choose a broker and connect to your account.
Crypto markets are famous for their volatility, so one should study all the available stats before adding crypto assets to their portfolio. Very often it's technical analysis that comes in handy. We prepared technical ratings for SAGA / USDT Spot Trading Pair (SAGA): today its technical analysis shows the strong sell signal, and according to the 1 week rating SAGA shows the sell signal. And you'd better dig deeper and study 1 month rating too — it's sell. Find inspiration in SAGA / USDT Spot Trading Pair trading ideas and keep track of what's moving crypto markets with our crypto news feed.
SAGA / USDT Spot Trading Pair (SAGA) is just as reliable as any other crypto asset — this corner of the world market is highly volatile. Today, for instance, SAGA / USDT Spot Trading Pair is estimated as 3.61% volatile. The only thing it means is that you must prepare and examine all available information before making a decision. And if you're not sure about SAGA / USDT Spot Trading Pair, you can find more inspiration in our curated watchlists.
You can discuss SAGA / USDT Spot Trading Pair (SAGA) with other users in our public chats, Minds or in the comments to Ideas.