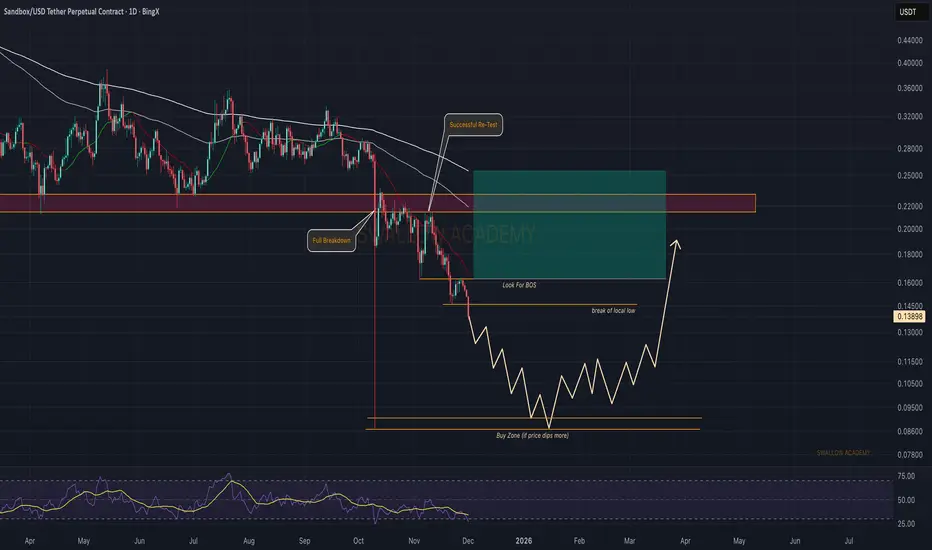
The Sandbox (SAND): Looking For Proper Break of Structure SAND broke down fully from its previous structure and is now sitting below all key levels. For now the chart still leans bearish, and as long as sellers keep control we might see one more push lower into the deeper buy zone. That’s where the better risk-to-reward setup would form.
If buyers manage
SANDUSDT 12H#SAND is moving inside a falling wedge pattern on the 12H timeframe. You can buy a small bag here and at the support level of $0.1466. If price breaks above the wedge resistance and the 12H SMA50, the potential targets are:
🎯 $0.1801
🎯 $0.2007
🎯 $0.2173
🎯 $0.2339
🎯 $0.2576
⚠️ Always remember to us


#SAND/USDT PUMP COMING ON SAND! #SAND
The price is moving within a descending channel on the 1-hour frame, adhering well to it, and is heading for a strong breakout and retest.
We have a bearish trend on the RSI indicator that is about to be broken and retested, which supports the upward breakout.
There is a major support area

#SANDUSDT Weekly Analysis — Final Base Test Before Potential Rec🏖️ #SANDUSDT Weekly Analysis — Final Base Test Before Potential Recovery?
🗓 Published: May 10, 2025
📊 Timeframe: 1W | Exchange: Binance
Author: @HamadaMark
🔍 Market Structure Overview
SAND has returned to its historical accumulation zone near $0.28–$0.33 after completing multiple falling wedge brea

Sandbox (SAND): Expecting Breakout From 200EMASAND is again pushing into the breakout zone that has been rejecting price for months. This time, momentum looks better as buyers are holding higher lows and slowly pressing against EMAs. If we get a proper breakout here, that’s where the shift starts — continuation toward the $0.50 zone comes next.
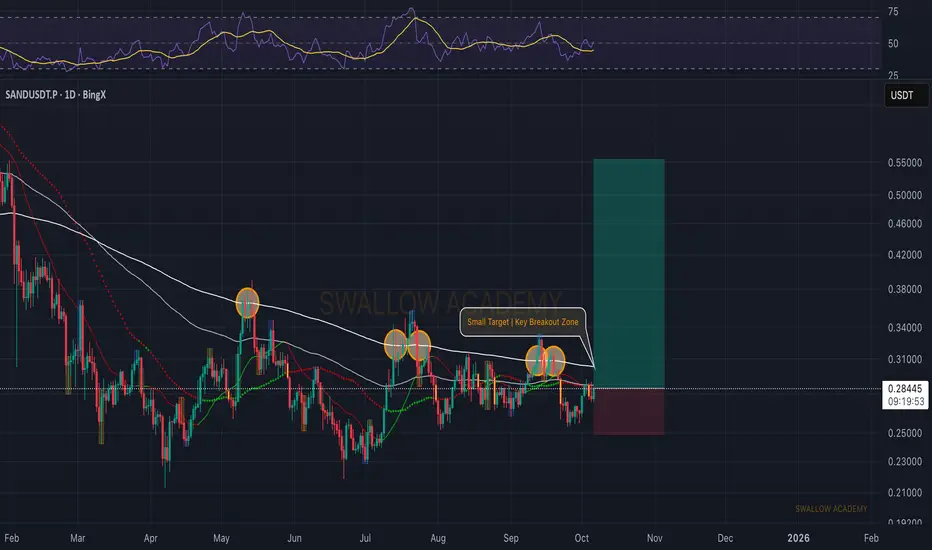
Sandbox (SAND): Looking For Break of 200EMASandbox has been in a downtrend for quite some time, and currently we are looking for proper upward movement, which could give us a decent switch in trend and an opportunity for long positions.
So as of now we have to wait and once we get that last confirmation of breakout, then we will be looking

SAND is Ready for 130% + Up Move SAND is making a Triangle pattern at Support zone and It is Ready for Breakout from that pattern . and at the same time Altcoin Season Index is at 74 , when it is >75 it is sign of very bullish in altcoins and Breakouts will have very high potential to give a big move .
and at the same time Bitcoin

SANDUSDT.P stuck in $0.26–0.35 range — breakout soon?Introduction: SAND is coiling in a tight $0.30–0.33 box; reaction will set next swing.
Trend: Higher lows since $0.27, rising into supply.
Levels: Resist $0.33, ATH targets $0.35–0.38; support $0.30, then $0.292/$0.275.
Pattern: Range box; break/close outside decides.
Indicators: Price above EMAs;

Sand Short to 0.23$Sand Short to 0.2308
Enter 0.345
SL 0.3609
TP 0.23
Sand will retest Symmetrical Triangle's top.
SL would have manually in case of wick above the top
Low leverage can enter now

See all ideas
Summarizing what the indicators are suggesting.
Oscillators
Neutral
SellBuy
Strong sellStrong buy
Strong sellSellNeutralBuyStrong buy
Oscillators
Neutral
SellBuy
Strong sellStrong buy
Strong sellSellNeutralBuyStrong buy
Summary
Neutral
SellBuy
Strong sellStrong buy
Strong sellSellNeutralBuyStrong buy
Summary
Neutral
SellBuy
Strong sellStrong buy
Strong sellSellNeutralBuyStrong buy
Summary
Neutral
SellBuy
Strong sellStrong buy
Strong sellSellNeutralBuyStrong buy
Moving Averages
Neutral
SellBuy
Strong sellStrong buy
Strong sellSellNeutralBuyStrong buy
Moving Averages
Neutral
SellBuy
Strong sellStrong buy
Strong sellSellNeutralBuyStrong buy
Displays a symbol's price movements over previous years to identify recurring trends.