SANTOSCRYPTOCAP:SANTOS is looking strong as price presses against the channel resistance. Momentum is building and the structure suggests a breakout is close. Once it triggers, the move can accelerate quickly.
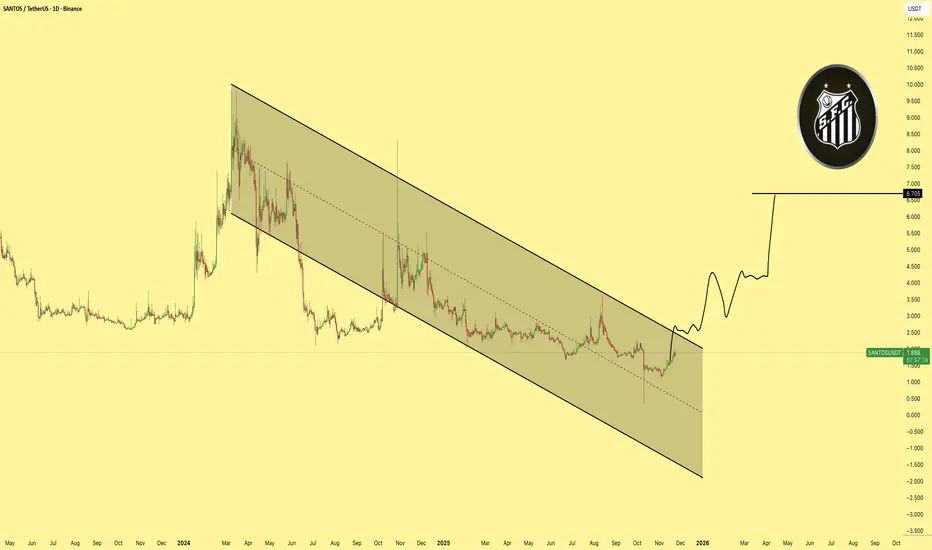
SANTOSCRYPTOCAP:SANTOS is trading inside a descending channel pattern, building pressure for a breakout. Once it moves, there’s a potential 300 percent gain from the current price to the measured target. Structure looks clean and momentum is starting to shift.

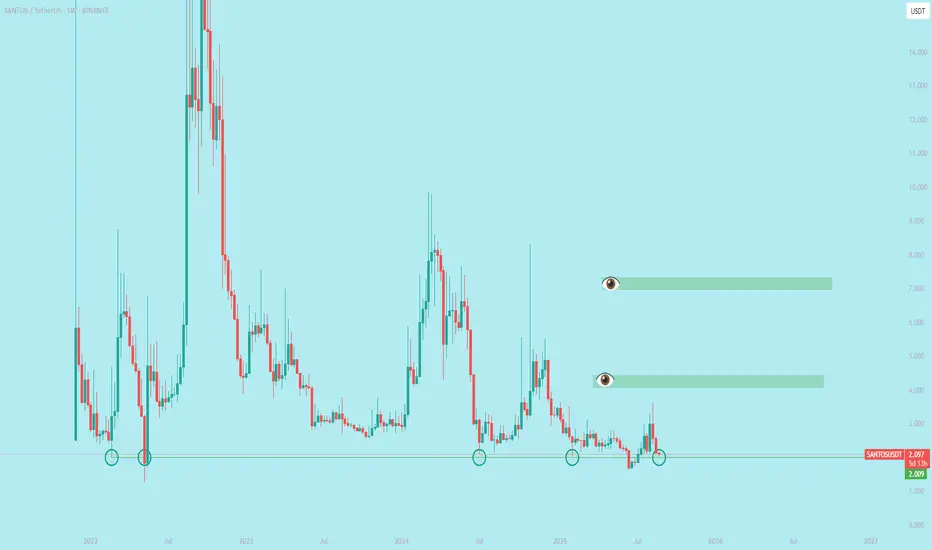
SANTOSUSDT 1D#SANTOS appears to be forming a double bottom pattern on the daily timeframe. RSI and MACD have turned bullish. Keep an eye on it. If the pattern gets confirmed, the potential targets could be:
🎯 $2.194
🎯 $2.350
🎯 $2.505
🎯 $2.727
🎯 $3.009
🎯 $3.368
🎯 $3.555
🎯 $3.824
🎯 $4.328
⚠️ Always remember to u

Santos 1H Rising WedgeOn the 1H chart, $SANTOS is trading inside a rising wedge ⚠️
If breakdown plays out, price may revisit the $1.75–$1.76 area.
#Crypto #SANTOS #Signals #SANTOSUSDT

SANTOS ANALYSIS (1D)Football-related tokens in the crypto market have been quiet for a while and seem to be dormant. One of the tokens that shows good inflow during its moves is SANTOS.
SANTOS appears to be forming a symmetrical triangle and is currently at the end of wave E. While there are multiple wave count scenar

Expecting a strong move from $SANTOSExpecting a strong move from $SANTOS, potentially yielding 50%.
A strong support line is a price level where an asset tends to stop falling due to significant buying interest (demand) that prevents further declines. It’s often identified by:Multiple Touches: The price has tested the level multiple
SANTOSUSDT | Long | Multi-Year Range Play | (Aug 15, 2025)📌 SANTOSUSDT | Long Setup | Fan Token Rotation + Structural Breakout | Aug 15, 2025
🔹 Thesis Summary
SANTOS is breaking above a long-term accumulation range within the underperforming fan token sector. Backed by Santos FC and Binance, this play targets asymmetrical upside on renewed engagement cycl

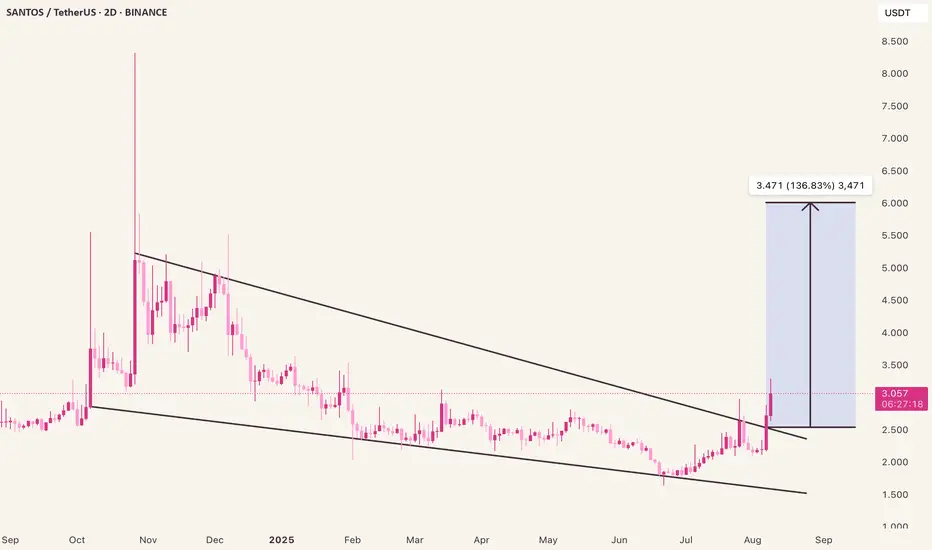
SANTOS/USDT – Bullish Breakout: Falling Wedge Targets +136%SANTOS has broken out of a multi-month falling wedge pattern, confirming the move with a strong bullish candle closing above the upper trendline. Current price is 3.026 USDT, up +11.33% for the session.
The measured move from the pattern projects a potential target near 6.50 USDT (+136.83% from the
Will Neymar Break Out the Price Action of Santos To the moon.
Neymar did return to Santos, the energy around the club has exploded.
He has: 📸 Instagram: approximately 231.4 million followers
🐦 Twitter (X): approximately 64 million followers
🔥 Fan engagement is surging: Social media growth, merchandise sales, and matchday hype have all increased.
⚽️ On-f

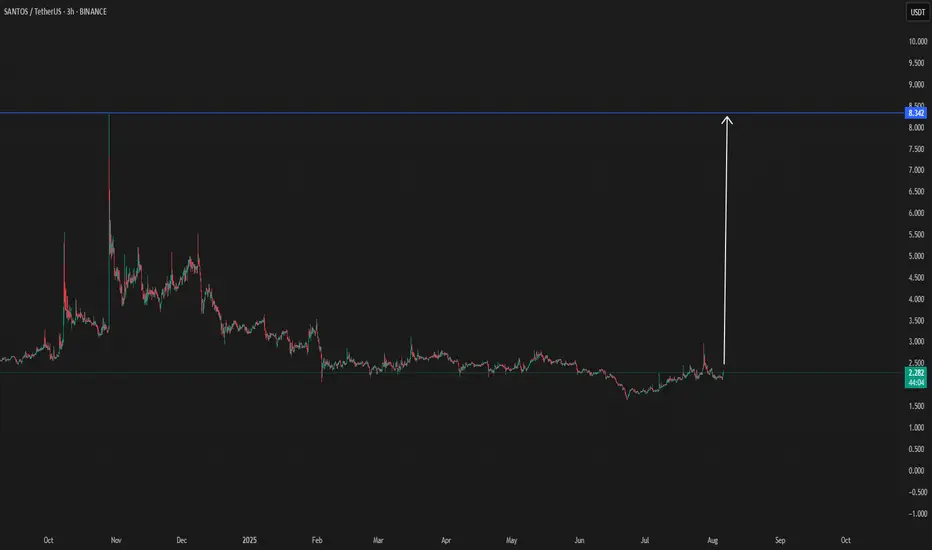
SANTOS/USDT $8 Possible targetSantos shows an interesting view since today, which can confirm a break
When there is confirmation will add here below
Like it did before, it can do it again.
See all ideas
Summarizing what the indicators are suggesting.
Oscillators
Neutral
SellBuy
Strong sellStrong buy
Strong sellSellNeutralBuyStrong buy
Oscillators
Neutral
SellBuy
Strong sellStrong buy
Strong sellSellNeutralBuyStrong buy
Summary
Neutral
SellBuy
Strong sellStrong buy
Strong sellSellNeutralBuyStrong buy
Summary
Neutral
SellBuy
Strong sellStrong buy
Strong sellSellNeutralBuyStrong buy
Summary
Neutral
SellBuy
Strong sellStrong buy
Strong sellSellNeutralBuyStrong buy
Moving Averages
Neutral
SellBuy
Strong sellStrong buy
Strong sellSellNeutralBuyStrong buy
Moving Averages
Neutral
SellBuy
Strong sellStrong buy
Strong sellSellNeutralBuyStrong buy
Displays a symbol's price movements over previous years to identify recurring trends.