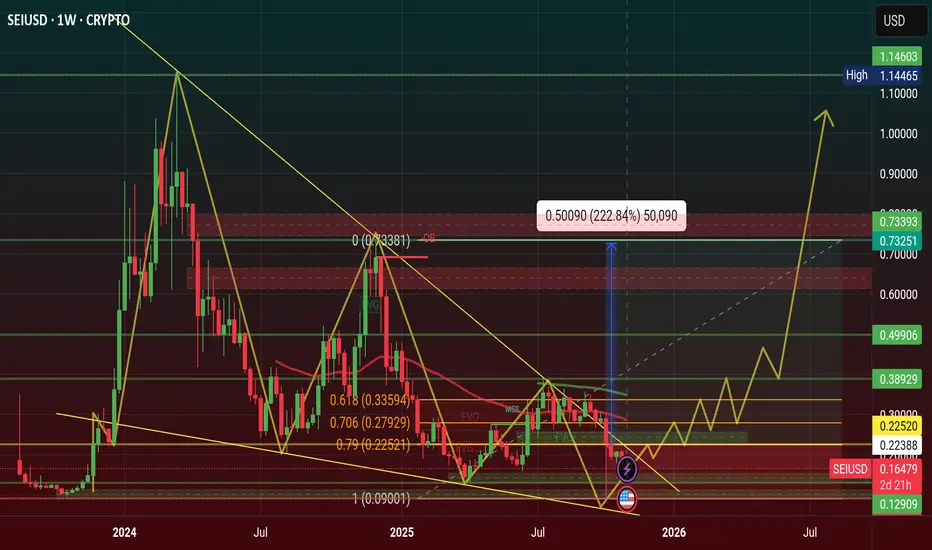
$SEI Price will hit $1.22 in 2026, Falling Wedge Pattern WeeklySEI price is showing a Bullish Pattern of Falling Wedge Pattern, when this pattern will create on chart after price will be upward direction.
Price Will hit $1.11 in 2026 and 2027 is $2.22, $3.33
Entry Point is $0.22, $0.27, $0.33 and Stoploss point $0.09
2026 Target point $0.49, $0.77, $1.11
2027 Target point $2.22, $3.33
#trending #Highlight #trendingideas #SEI #SUBROOFFICIAL
Disclaimer: This article is for informational purposes only and does not constitute financial advice. Always conduct your own research before making any investment decisions. Digital asset prices are subject to high market risk and price volatility. The value of your investment may go down or up, and you may not get back the amount invested. You are solely responsible for your investment decisions and Binance is not available for any losses you may incur. Past performance is not a reliable predictor of future performance. You should only invest in products you are familiar with and where you understand the risks. You should carefully consider your investment experience, financial situation, investment objectives and risk tolerance and consult an independent financial adviser prior to making any investment.
Trade ideas
SEI ready to take offSEI are ready to takeoff my target for this is above 1$ I will sale 50% at 1$ next target are 1.85 - 2.5

SEI 8H – Breakout After Fib Defense, Targeting Liquidity SEI has respected multiple Fib reactions, holding the 0.5 retracement ($0.2758) and defending the golden pocket ($0.2484) on prior dips. Price has since reclaimed both the 50 EMA ($0.302) and 200 EMA ($0.297) while riding the ascending trendline for confluence.
Upside:
Current move shows a breakout attempt above $0.325.
Next liquidity sits at $0.3845, a key resistance level to clear.
Downside:
Failure to hold $0.30 risks a drop back into the 0.275–0.248 Fib cluster, with the 0.786 retrace ($0.209) as the last line of support.
Stoch RSI is overbought, suggesting short-term cooling, but structure remains bullish above $0.30.
📊 Key focus: Does SEI convert $0.325 into support for continuation toward $0.3845, or retest the Fib cluster below first?

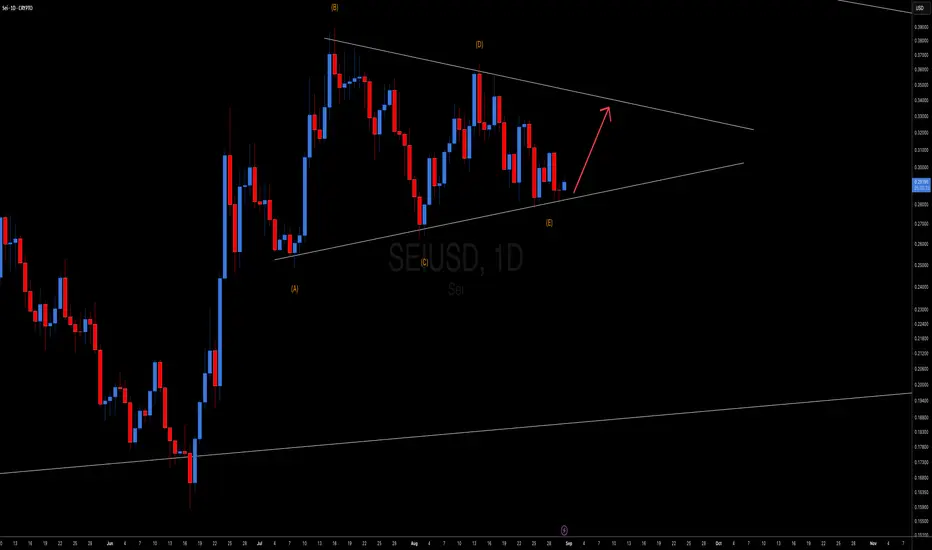
Bullish Move Up to complete Elliot Wave Triangle CorrectionBullish Move Up to complete Elliot Wave Triangle Correction
SEI 4H – Testing $0.39 Resistance After Trendline RallySEI has rallied sharply from its ascending trendline, pushing toward the $0.39–$0.40 resistance zone that capped previous highs. The Stoch RSI is deep in overbought territory, suggesting possible consolidation or a minor pullback before any breakout attempt. A confirmed move above $0.40 could target $0.43+, while losing the $0.33 trendline support would shift momentum back to the downside.

SEI 8H – Same Fib Zone, Same Bounce… Same Outcome?SEI just tapped the exact same golden pocket zone that launched its last major breakout — and it’s already showing signs of a repeat performance. The 8H chart displays a nearly perfect mirror setup, with price double-tapping the 0.5–0.618 retracement zone and bouncing with momentum.
With Stoch RSI flipped up and price reclaiming the midpoint, this sets up a high-probability, high-RR trade targeting the upper range near $0.39.
📍 0.5 (0.2725): Midpoint reclaim underway
📍 0.618 (0.2447): Golden Pocket → exact reaction level
📍 0.786 (0.2051): Clear invalidation
📍 Target Zone (~$0.39): Range high from July rally
The structure is almost identical to early July — and if history repeats, we could be seeing another 30–40% leg higher.
This is how traders weaponize memory and structure.
👇 Are you taking this bounce or waiting for confirmation?

SEI - MACD Liquidity Tracker Nailed the Long, Now Flipping ShortThe MACD Liquidity Tracker Strategy just clocked a +103% long trade on SEI before momentum flipped and a short signal fired on this 8H chart.
The previous long captured a textbook impulse — clean MACD crossover, EMA alignment, and breakout confirmation. Now price is back under the 50/100 EMA, and MACD is turning decisively bearish.
📌 What’s notable:
QTP Strategy caught the entire move from ~$0.19 to ~$0.38
Fresh short entry printing as structure breaks down
MACD histogram and signal lines aligning with bearish momentum
If trend continuation plays out, this short could target the $0.24–0.22 zone. Alternatively, a reclaim of $0.30+ would invalidate.
Built-in logic helps filter out chop, so we’re watching to see if this becomes the next clean leg — or a trap before reversal.
—
Test it yourself with our preset configs or tweak for SEI’s volatility.
Ready for this reversal?👇

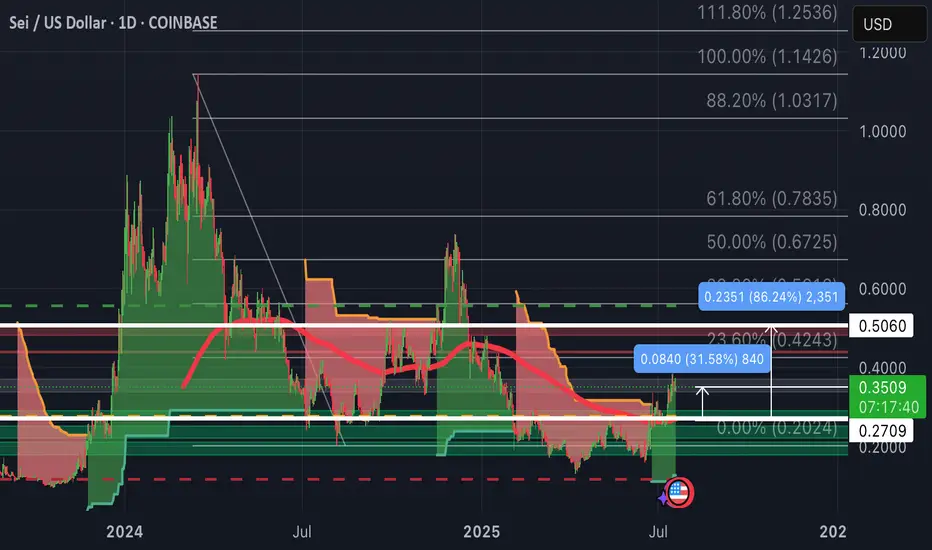
SEI-Update:Up 31% so far as we wait for the big retest back @ $1Entry was at $0.27, made a dip below this support line then recovered.
Macro retest would be 100% Fibonacci Correction back to $1.00.
First we shall break thru the $0.50 Resistance (will be a 86% gain).
Then push up past 50% Fibonacci at $0.6725, then $0.7835.
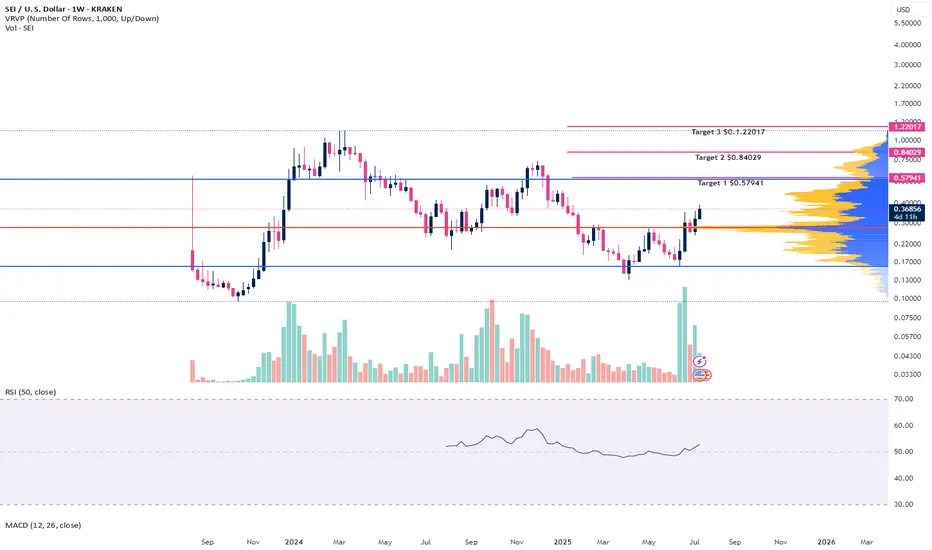
$SEIUSD - looks great for a longCOINBASE:SEIUSD
Looks great long term and targets provided should be hit by EOY.
Open active trade = $0.2930
SEI - I love the look of the chart. NYSE:SEI is a new crypto I have come across. Fundamentals look great and the chart looks even better.
I have just opened my first trade on it.
It should target $0.58 to $1.23 this cycle with a few stops along the way highlight in green.
Let's see how it plays out.
Good luck to everyone involved in $SEI!

SEI up to 221% ROIFrom a total of 17 technical indicators, 12 calls to buy, and 3 to sell, the prediction sentiment short-term is bullish based on technical price analysis. The first major uptrend resistance for SEI is at the $0.3001 level, it needs to close above that level to continue to move higher, and bottom support sits at $0.2565. So if the price falls below $0.2565, we may see the price go even lower. If SEI closes above $0.3001, it could rise to the next resistance level at $0.3368.
On the daily chart, exponential moving averages show a bullish signal. Sei price currently sits above all 10,20,50,100, and 200-day EMAs.
Long entry: 0.20691
TP: 0.66447
ROI: 221.13%

SEI Turns Bullish After A Zig-Zag CorrectionSEI Turns Bullish After A Zig-Zag Correction, as we see it sharply bouncing from projected support that can send the price higher by Elliott wave theory.
SEI with ticker SEIUSD is waking up exactly from the channel support line and equality measurement of waves A=C, which is perfect textbook support for subwave (5) of an impulse into wave C of an ABC zig-zag correction. It's actually nicely and impulsively rising for wave 1, so after current wave 2 pullback, be aware of a bullish continuation within wave 3 of a five-wave bullish cycle, especially if breaks above 0.30 first bullish evidence level.
Sei (SEI) is a high-performance Layer 1 blockchain designed specifically for decentralized finance (DeFi) and decentralized exchanges (DEXs). Launched in August 2023 by Sei Labs, it features innovations like Twin-Turbo Consensus for fast block finality, Optimistic Parallelization for high throughput, and SeiDB for efficient transaction handling. It supports EVM compatibility, enabling seamless deployment of Ethereum-based apps. The SEI token is used for transaction fees, staking, governance, and liquidity.

SEI breaks the downtrend targets 30cThe SEI network is currently displaying positive price movement after recently breaking out of a downward trend channel that had been in place since the peak on December 5th. On the daily chart, it has been trading sideways within the upper channel, indicating a potential retest of that breakout. However, the momentum isn't particularly strong, especially since Ethereum, the frontrunner in the altcoin resurgence, isn't exhibiting explosive upward movement either.
Should the situation shift and Ethereum regain its leading position, I believe that many struggling smart contract platforms, which have seen their prices plummet by over 80%, could also experience a robust recovery.
If Ethereum manages to climb back into the $2,000+ range, I anticipate that SEI will reach its target on the chart, which is approximately 30 cents.

Definitely like SEIUSDT Bounce off the $0.1473 Level Looking at SEIUSDT - for a bullish candle move off the support zone.
Would like to see a move into the $0.30 - $0.50 cent range.
And why not scoop some up at these lower levels.

SEI will reach at 1.4$
Price Movement and Trend:
The chart shows a significant upward movement starting around mid-2024, peaking at a high (likely around $1.14-$1.20 based on the vertical scale), followed by a sharp decline.
After the peak, the price enters a consolidation phase with lower volatility, fluctuating around the "Accumulation zone" marked at approximately $0.196746.
A recent upward trend is suggested, with the price appearing to approach or break above the $1.143922 level (labeled as "Target 1.4$"), indicating potential bullish momentum.
Accumulation Zone:
The "Accumulation zone" is identified around $0.196746, which seems to act as a support level where the price has stabilized after the decline. This zone likely represents a range where buyers have been accumulating the asset, potentially preparing for the next upward move.
The prolonged consolidation in this range suggests a period of low selling pressure and possible buying interest.
Target 1.4$:
The chart highlights a target price of $1.4, with the current price nearing $1.143922. This suggests that the analyst or trader anticipates a potential rise to $1.4 if the current upward trend continues.
The upward arrow and the proximity to this target indicate a bullish outlook, possibly driven by a breakout from the accumulation phase.
Volume and Candlestick Patterns:
While the chart doesn’t explicitly show volume bars, the candlestick patterns (green for bullish, red for bearish) indicate periods of buying and selling pressure. The recent green candles suggest increasing buying interest.
The sharp drop after the peak and the subsequent consolidation could indicate profit-taking followed by a base-building phase.
Timeframe and Context:
The chart covers a period from mid-2024 to March 2025, with the current date being March 14, 2025. This long-term view suggests the analysis is focused on a medium-to-long-term trend rather than short-term fluctuations.
The upward trajectory toward $1.4$ might be based on technical analysis (e.g., resistance levels, Fibonacci extensions, or historical price action), though specific indicators are not visible.
Interpretation:
The chart suggests that SEI/USDT has undergone a significant rally, followed by a correction and consolidation in the accumulation zone around $0.19-$0.20. The recent upward movement toward $1.14 indicates a potential breakout or continuation of an uptrend.
The target of $1.4$ could represent a resistance level or a projected price based on the analyst’s strategy (e.g., a measured move from the accumulation range).
Traders might interpret this as a buying opportunity if the price holds above the accumulation zone, with a stop-loss potentially set below $0.19, aiming for the $1.4 target.

SEI: Is There a Chance for an Upside Reversal? Altcoin AnalysisSEI: The price has not provided a clear indication that a substantial low has formed. A break above $0.337 is needed for an indication that a low of sorts has formed. However, as long as the rally is not in 5 waves and the foundation remains corrective and is based on 3-wave structures, any move to the upside could simply be a wider corrective rally. I do not see a clear pathway for higher prices at this point, but the area around $0.20 offers some support. Below this level, $0.136 and $0.09 are the next support levels.

SEI - Time to look after WLF purchased With Trumps WLF buying just under $200K worth of SEI let us take a look. Remember WLF is interested in decentralized finance protocols and lending.
www.tradingview.com
Coming off macro low support and volume profile VAL.
MACD and RSI getting more bullish.
Plenty of take profit zones evenly spaced out by $0.10 increments is very attractive.

Lets See If SEI Could Make It!!
Currently we got a Change Of Character on #SEIUSDT on 4hrly time frame, which indicates the sign of strength.
By this, we may see #sei tapping into it's bullish Order Block and then bullish momentum upto previous highs as mentioned in chart

SEI to 10XWhat Is The Sei Network?
Sei is an innovative open-source Layer 1 blockchain designed to enhance the trading experience of digital assets.
Renowned for its remarkable speed, the Sei Network stands out as one of the fastest blockchains available, capable of executing an astonishing 12,500 transactions per second with a block finality time of just 380 milliseconds. This incredible efficiency positions Sei as an ideal platform for developing decentralized exchanges, gaming finance (GameFi) applications, and NFT marketplaces.
Built on the Cosmos SDK framework, Sei enjoys interoperability with the Inter-Blockchain Communication Protocol (IBC). This allows SEI to effortlessly transfer data and tokens across various IBC networks while maintaining its distinct foundational architecture.
KEY INSIGHTS:
— The Sei Network operates as a Layer 1 blockchain within the Cosmos ecosystem, focusing on providing robust trading infrastructure tailored for decentralized exchanges and marketplaces.
— With its innovative twin-turbo consensus mechanism, Sei enhances blockchain performance and achieves block finality in just 380 milliseconds.
— Additionally, the network features an integrated order book and matching engine, empowering developers to build scalable, efficient, and user-centric decentralized exchanges.

SEI/USD - Perfect SetupLONG -
Tweezer Bottom, Bullish engulfing candle (with follow-through) at key support after completing 88.6% retrace. Minimum upside 30%+


SEI - Breakdown Target ReachedOur post on SEI from December 8th, we were monitoring a breakdown and retest from its triangle pattern. In that post, I said I would make a follow up once the breakdown target is reached and here we are! Also, Here is a link to that previous prediction:
Our measured move breakdown target was $0.44-$0.45. Price is a little lower than that now but the first target has been reached. If we do drop lower we could see $0.40 followed by support at the 200MA.
These targets were also mentioned in this post if price was to break the $0.50 level (which it did). Hope these charts help!

SEI - Important LevelSei is also at an important level. Looking at the 8H chart price is trying to from support. Price is currently being supported by the 8H 200 ma, price has created an 8H doji the could signal a reversal to the upside, price is being supported by the 0.618 golden ratio around the psychological $0.50 level, and the RSI could be forming a slight bullish divergence if we get a bounce here.
On the contrary, if price fails to hold this level as support, we could see a swift move to0 the $0.44-$0.45 level and potential a test as low as $0.40. Keep all these targets in mind if we do see a breakdown, but for now watch and see if buyers step in at this level.
