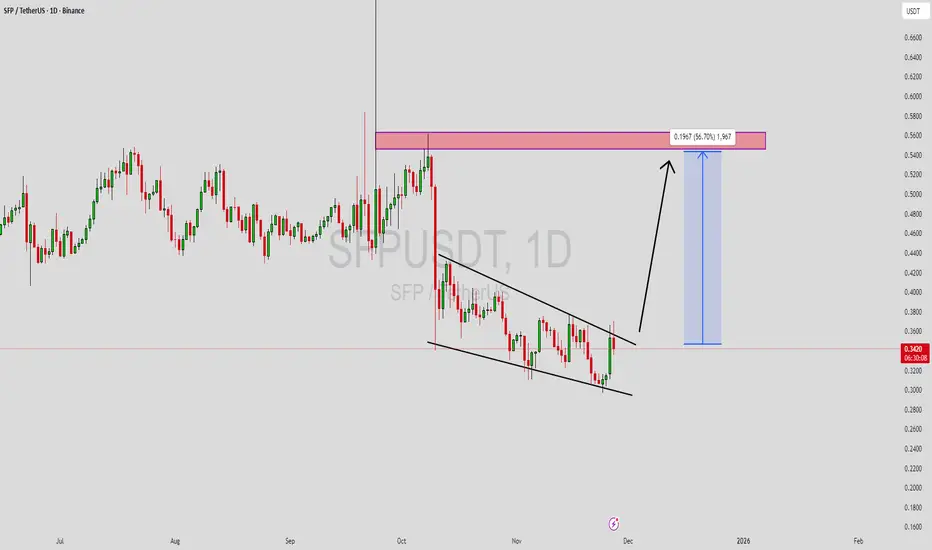
SFPUSDT Forming Falling WedgeSFPUSDT is forming a clear falling wedge pattern, a classic bullish reversal signal that often indicates an upcoming breakout. The price has been consolidating within a narrowing range, suggesting that selling pressure is weakening while buyers are beginning to regain control. With consistent volume
SFPUSDT 12H#SFP is moving inside a descending channel on the 12H timeframe. It attempted to break out of the channel but was rejected by the SMA100. Keep an eye on it — price may retest the support before the next leg up. If it breaks above both the channel resistance and the SMA100, the potential targets are:

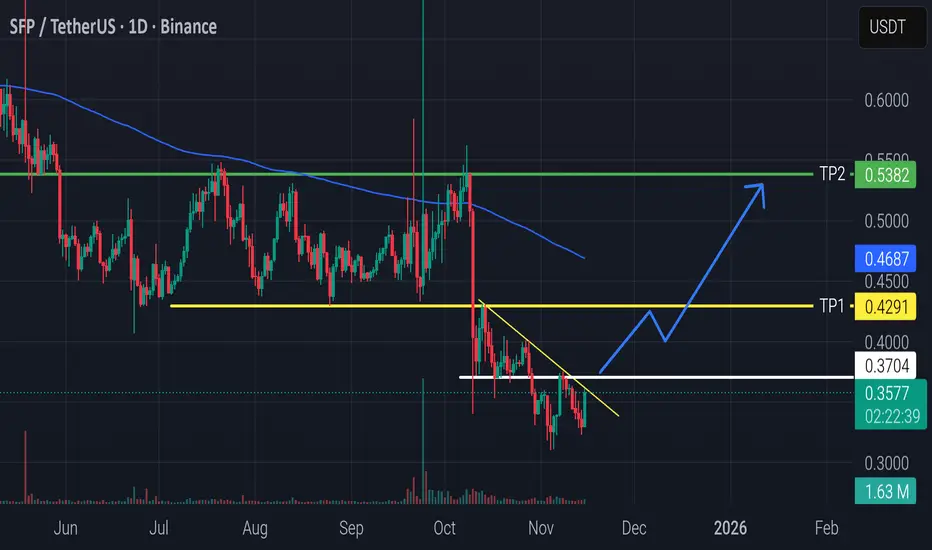
SFP/USDT – Daily Timeframe AnalysisSFP is attempting a breakout from a descending trendline after forming a strong support base around 0.35.
A successful breakout can trigger a bullish continuation toward key resistance levels.
Key Levels to Watch:
🔹 Entry Zone: Above 0.3704 (confirmed break)
🔹 TP1: 0.4291
🔹 TP2: 0.5382
🔹 Major Resi
SFPSFP is out of trend — it has been moving horizontally for 2 years, indicating a stagnation of interest.
The price has been forming lower highs since the beginning of 2024, which strengthens the bearish structure.
The current candle is red, but not extreme, which suggests weak but consistent sellin

SFPUSDT %132 Daily Volume SpikeSFPUSDT Analysis: Significant Volume Spike and Potential Move to Fresh Zones
There is a 132% daily volume increase in SFPUSDT, making it worth examining.
Currently, the price has almost exhausted the demand zone it recently reacted from. I believe it may now look for fresh demand zones at lo

SFPUSDT | Watching the Blue Boxes for Bullish BreakoutsSFPUSDT has settled into a well‑defined area of interest and I’ll be focused on how price behaves inside the blue box. This zone has acted as support in prior pullbacks and now it could offer traders an opportunity for a quick upside move.
🟦 Blue Boxes = Support Zones
This areas has repeatedly attr

SFP’s 43x Potential: Now the Time to Jump In?SEED_DONKEYDAN_MARKET_CAP:SFP has been forming a large symmetrical triangle since its listing. The market makers have deliberately used two stages over more than 1,000 days to consolidate.
▍Stage 1: Consolidation lasted from 05/2022 to 10/2023, spanning 521 days (marked with a blue box).
▍Stage 2

SFP to SFP $1 Bullish AFManage Risk!
Wait for Reversal patterns
And for price to come to levels
Be sure to let a little ride.
Bullish overall market structure

SFPUSDT long trigger Claiming the SR and retest.
Adding to longs from here with tight invalidation.
Holding here for a while and this can push higher from here.
Entered under 0.7300
Looking for 0.85 and 1+
Invalidation clean breaking the area.
Note: Not a Financial Advise.

SFPUSDT 1WSFP ~ 1W
#SFP This trade is high risk. But if you still have Conviction on the coin,. This is a very good support block to start buying gradually,. with short term targets Minimum 20%+

See all ideas
Summarizing what the indicators are suggesting.
Oscillators
Neutral
SellBuy
Strong sellStrong buy
Strong sellSellNeutralBuyStrong buy
Oscillators
Neutral
SellBuy
Strong sellStrong buy
Strong sellSellNeutralBuyStrong buy
Summary
Neutral
SellBuy
Strong sellStrong buy
Strong sellSellNeutralBuyStrong buy
Summary
Neutral
SellBuy
Strong sellStrong buy
Strong sellSellNeutralBuyStrong buy
Summary
Neutral
SellBuy
Strong sellStrong buy
Strong sellSellNeutralBuyStrong buy
Moving Averages
Neutral
SellBuy
Strong sellStrong buy
Strong sellSellNeutralBuyStrong buy
Moving Averages
Neutral
SellBuy
Strong sellStrong buy
Strong sellSellNeutralBuyStrong buy
Displays a symbol's price movements over previous years to identify recurring trends.