Can #SNX Recover From Here or Will it Continue to Fall?Yello, Paradiser! Are you prepared for the moment when #SNXUSDT finally decides whether it will punish late bears or wipe out impatient longs? Let's look at the #Synthetix trade setup:
💎#SNX is currently trading around $0.418 on the 4H timeframe and remains stuck inside a clearly defined descending

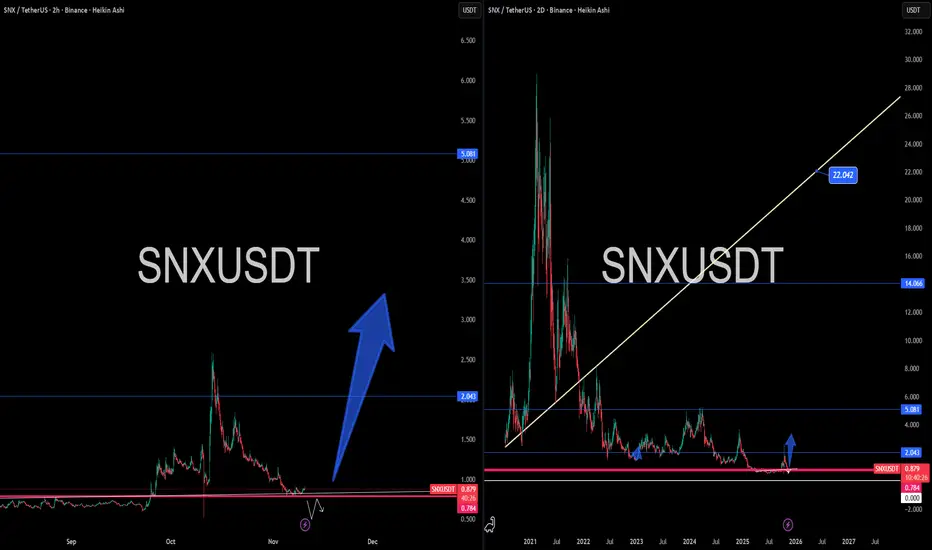
SNX – The OG DeFi Token Awakens?SNX – The OG DeFi Token Awakens? 🧬🚀
Synthetix (SNX) is back on the radar, trading just above its historic base at $0.78–$0.88 — the same accumulation zone that birthed past monster runs.
This isn’t just nostalgia. The OG DeFi protocol is launching a new DEX in the coming weeks, built on L2 Ethereu
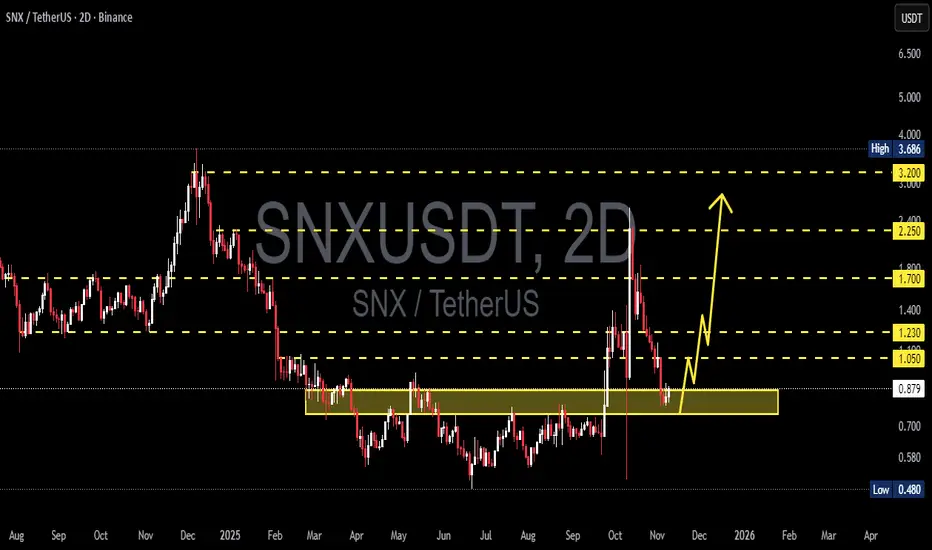
SNX/USDT Golden Zone 0.87–0.75 — Accumulation or Breakdown AheadSNX has returned to the golden zone at 0.87–0.75, a level that has historically acted as the main battlefield between buyers and sellers.
Price is now retesting the same area that once served as the foundation of a strong accumulation phase earlier this year.
But this time, the context is different
SNX : SIGNALHello friends
Given the good growth we had and the arrival of buyers, now that the price is correcting, there is a good opportunity to buy in steps with risk and capital management and move towards the specified goals.
*Trade safely with us*

SNXUSDT is a wild Dear Friends,
by reviewing the chart , the trader may be speechless for a while by following candles in bulish and bearish moves. it is really wild.
Synthetix is an ERC-20 token created by the Synthetix protocol that serves multiple purposes. In addition to serving as collateral on the protocol, b

SNX - BULLISHIm buying this dip on #SNX 📈 (DCA from previous charts)
💣POC Point daily supporting prices nicely
💣Clean bull div RSI
💣C&H pattern structure M15
I expect to see a downtrend breakout & a 20%+ bull move from this support zone!
Everything is in my chart!
Just sharing EPIC Chart analys

SNX - BULLISH NYSE:SNX - Bullish candle close H1 ✅
Falling wedge breakout likely, big green dildo could follow 🚀👀
I'm buying here, before the real FOMO.
Not a financial advice guys. (you know)

#SNX/USDT — Recovery Mode?#SNX
The price is moving within a descending channel on the 1-hour frame, adhering well to it, and is heading for a strong breakout and retest.
We have a bearish trend on the RSI indicator that is about to be broken and retested, which supports the upward breakout.
There is a major support area i

SNX/USDT INCREASE VOLUME On the lower time frames, SNX is showing signs of increasing volume, which could build up over time. For this reason, it’s worth watching SNX closely to see if the trend can break.
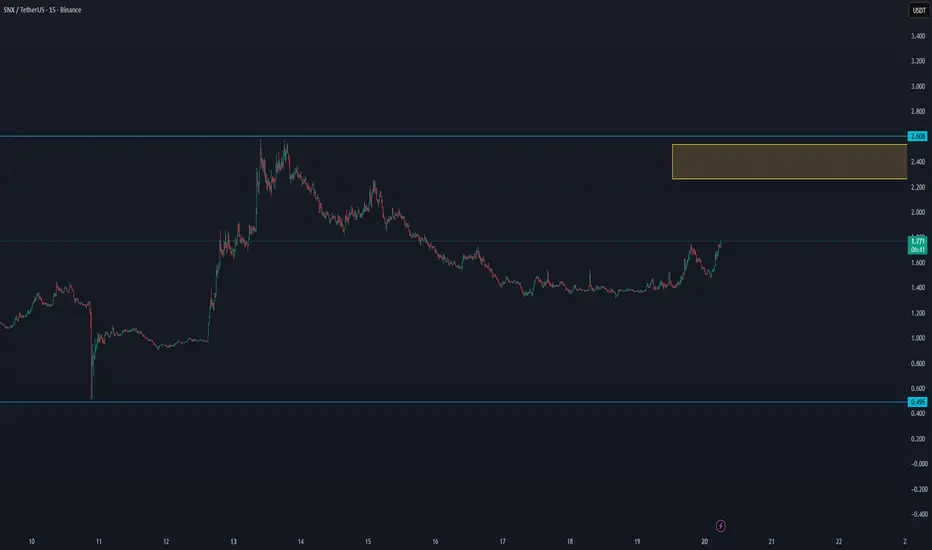
SNXUSDT: Potential for Upward Momentum Towards $2.25SNXUSDT has demonstrated significant bullish momentum, breaking out of a consolidation phase with a remarkable +26.08% surge on October 19, 2025. This move pushed the price to a high of $1.7396, indicating strong buying pressure.
The price is currently situated above the crucial Fibonacci retraceme

See all ideas
Summarizing what the indicators are suggesting.
Oscillators
Neutral
SellBuy
Strong sellStrong buy
Strong sellSellNeutralBuyStrong buy
Oscillators
Neutral
SellBuy
Strong sellStrong buy
Strong sellSellNeutralBuyStrong buy
Summary
Neutral
SellBuy
Strong sellStrong buy
Strong sellSellNeutralBuyStrong buy
Summary
Neutral
SellBuy
Strong sellStrong buy
Strong sellSellNeutralBuyStrong buy
Summary
Neutral
SellBuy
Strong sellStrong buy
Strong sellSellNeutralBuyStrong buy
Moving Averages
Neutral
SellBuy
Strong sellStrong buy
Strong sellSellNeutralBuyStrong buy
Moving Averages
Neutral
SellBuy
Strong sellStrong buy
Strong sellSellNeutralBuyStrong buy
Displays a symbol's price movements over previous years to identify recurring trends.