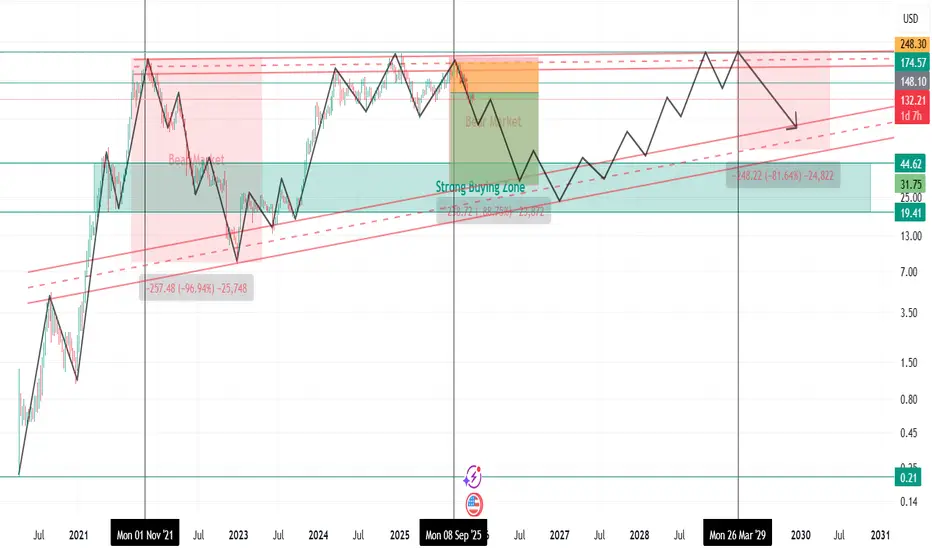
SOLUSD Long-Term Market Cycle Analysis |Bear Market Phase ActiveSolana (SOL) was listed on 10 April 2020 at around $0.21 .
During the 2020–2021 bull market (Altseason Phase-4) , SOL showed an exceptionally strong rally after listing and formed its all-time high near $260 on 6 November 2021 .
From that point, a major bear market started.
Between 7 April
Key facts today
Key stats
About Solana
Solana is a blockchain fairly new to the crypto game, but that's not to say it's not a serious player. Attempting to rival smart-contract titan Ethereum for the NFT and web3 crown, Solana has a strong focus on scalability through its hybrid proof-of-history/proof-of-stake consensus that aims to accommodate a flourishing dApp ecosystem. Its native token SOL has enjoyed the successes of Solana-based NFTs and dApps, but since its inception has also felt the strain of the network’s tendency to experience outages. Although that hasn't stopped it from reaching the top 15 coins by market cap.
Related coins
SOL very Bullish , Stronger Fundamentalafter ranging for long period of time finally we enter a supercycle, after we watch fed meeting the path is clear. there is no more hawkish, there is more cuts on 2026, we also have Kevin Hassett to make sure everything will goes as Trump's plan. 165k-200k BTC is very possible , 9K-12k ETH is very p

Solana Rebounds Weakly with No Clear Trend SignalsSolana on the 4H timeframe is only showing a mild pullback, as neither technicals nor news indicate fresh inflows strong enough to shift momentum. Price remains capped below the 138–142 FVG resistance cluster, and although small rebounds occur, their narrow range highlights the lack of aggressive bu

SOLUSD- SOLANA SELLS#SOLUSD I am looking for a sell opportunity if price breaks 130 and a sell continuation if 127 is broken. Target profit 112 and stops above 135

just for watchingdon't expect this to happen but is here to show odds and probabilities
10:1 4:1 or a 3:1 choice is yours but could all be wrong as the market is caught up in major chop.

TRADELINEOFMINESOLUSD is now trying to go up trend but becareful, Market makers behind this now and playing seriously with millions, always watch this move, if you do not want to lose your money, this is not the time of set it and forget it. I had 139.00 long with TP 145.00 and keep watching.

SOLANA MACRO VIEW !
1. Macro Trend: Ascending Channel
The most dominant feature of this chart is the massive ascending parallel channel (the two long black lines sloping upwards).
Long-Term Bullish: Despite volatility, the price has generally trended upward over the last several years, respecting the boundaries of
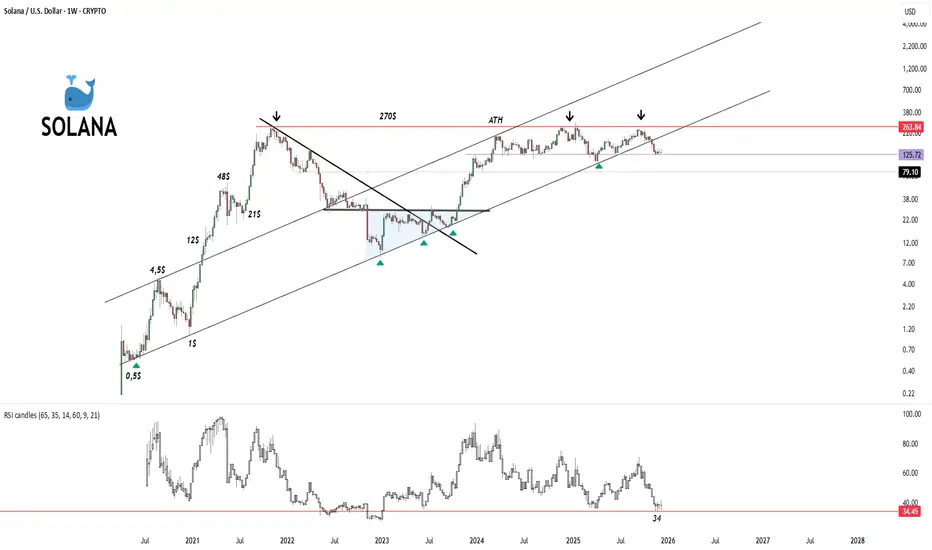
$SOL Solana is currently in a clear accumulation phase following a strong reaction from the major demand zone.
The horizontal accumulation in this zone indicates both a re-intensification of liquidity and the market gathering energy for the next directional breakout.
As long as the region holds, the s

Solana Sitting in Wholesale Zone: Here’s What the Chart ShowsA **Fibonacci retracement** from ~95 (0 level) to ~296 (1.0 level).
The major levels highlighted:
0.382 ≈ 171.87
0.618 ≈ 219.37
1.0 ≈ 296.25
1.618 ≈ 420.63
Price currently around 135–136
Region coloring:
Wholesale zone** (green, ~95–140)
Equilibrium zone** (yellow/green, ~170–220)
Retail zone**

SOL Breakdown: Still No Bull Signal Below $133SOL has been chopping sideways after the broad downtrend. Price failed to reclaim previous supply layers (~$180–$200), holding under resistance again.
Indicators:
RSI: ~43 (bearish-short term)
MACD: flat to slightly bearish, no strong bullish cross
Structure:
Lower lows still intact. No bullish

See all ideas
Summarizing what the indicators are suggesting.
Oscillators
Neutral
SellBuy
Strong sellStrong buy
Strong sellSellNeutralBuyStrong buy
Oscillators
Neutral
SellBuy
Strong sellStrong buy
Strong sellSellNeutralBuyStrong buy
Summary
Neutral
SellBuy
Strong sellStrong buy
Strong sellSellNeutralBuyStrong buy
Summary
Neutral
SellBuy
Strong sellStrong buy
Strong sellSellNeutralBuyStrong buy
Summary
Neutral
SellBuy
Strong sellStrong buy
Strong sellSellNeutralBuyStrong buy
Moving Averages
Neutral
SellBuy
Strong sellStrong buy
Strong sellSellNeutralBuyStrong buy
Moving Averages
Neutral
SellBuy
Strong sellStrong buy
Strong sellSellNeutralBuyStrong buy
Displays a symbol's price movements over previous years to identify recurring trends.
Curated watchlists where SOLUSD is featured.

Gen 3 crypto: A new day dawns…
25 No. of Symbols

Smart contracts: Make the smart decision
36 No. of Symbols

Staking Coins: Pick up a stake
18 No. of Symbols

Top altcoins: Choose your alternatives carefully
28 No. of Symbols

Up-and-coming crypto: New kids on the block
30 No. of Symbols
See all sparks
Frequently Asked Questions
The current price of Solana (SOL) is 124.55200 USD — it has risen 2.29% in the past 24 hours. Try placing this info into the context by checking out what coins are also gaining and losing at the moment and seeing SOL price chart.
The current market capitalization of Solana (SOL) is 70.00 B USD. To see this number in a context check out our list of crypto coins ranked by their market caps or see crypto market cap charts.
Solana (SOL) trading volume in 24 hours is 2.89 B USD. See how often other coins are traded in this list.
Solana price has risen by 0.03% over the last week, its month performance shows a −4.70% decrease, and as for the last year, Solana has decreased by −43.28%. See more dynamics on SOL price chart.
Keep track of coins' changes with our Crypto Coins Heatmap.
Keep track of coins' changes with our Crypto Coins Heatmap.
Solana (SOL) reached its highest price on Jan 19, 2025 — it amounted to 295.00000 USD. Find more insights on the SOL price chart.
See the list of crypto gainers and choose what best fits your strategy.
See the list of crypto gainers and choose what best fits your strategy.
Solana (SOL) reached the lowest price of 8.10000 USD on Dec 29, 2022. View more Solana dynamics on the price chart.
See the list of crypto losers to find unexpected opportunities.
See the list of crypto losers to find unexpected opportunities.
The current circulating supply of Solana (SOL) is 616.17 M USD. To get a wider picture you can check out our list of coins with the highest circulating supply, as well as the ones with the lowest number of tokens in circulation.
The safest choice when buying SOL is to go to a well-known crypto exchange. Some of the popular names are Binance, Coinbase, Kraken. But you'll have to find a reliable broker and create an account first. You can trade SOL right from TradingView charts — just choose a broker and connect to your account.
Crypto markets are famous for their volatility, so one should study all the available stats before adding crypto assets to their portfolio. Very often it's technical analysis that comes in handy. We prepared technical ratings for Solana (SOL): today its technical analysis shows the sell signal, and according to the 1 week rating SOL shows the sell signal. And you'd better dig deeper and study 1 month rating too — it's sell. Find inspiration in Solana trading ideas and keep track of what's moving crypto markets with our crypto news feed.
Solana (SOL) is just as reliable as any other crypto asset — this corner of the world market is highly volatile. Today, for instance, Solana is estimated as 9.51% volatile. The only thing it means is that you must prepare and examine all available information before making a decision. And if you're not sure about Solana, you can find more inspiration in our curated watchlists.
You can discuss Solana (SOL) with other users in our public chats, Minds or in the comments to Ideas.