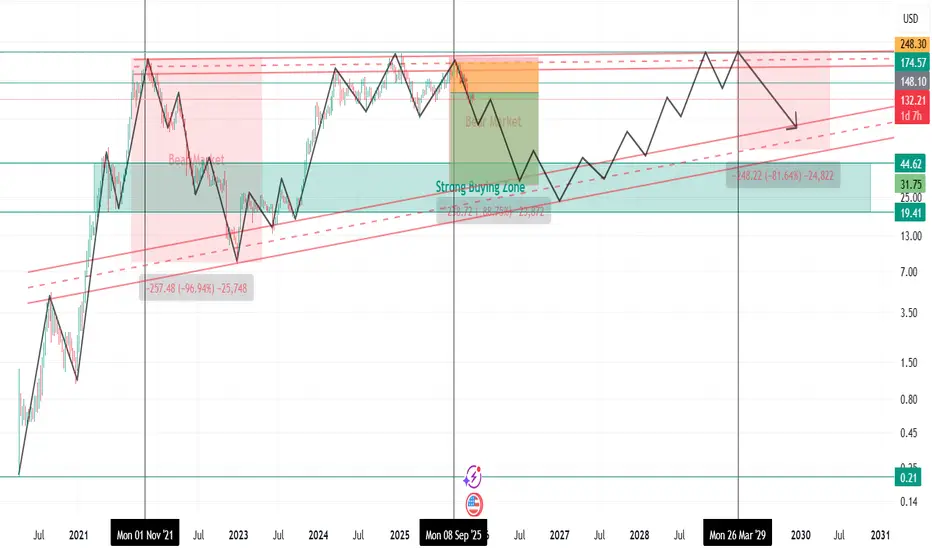
SOLUSD Long-Term Market Cycle Analysis |Bear Market Phase ActiveSolana (SOL) was listed on 10 April 2020 at around $0.21 .
During the 2020–2021 bull market (Altseason Phase-4) , SOL showed an exceptionally strong rally after listing and formed its all-time high near $260 on 6 November 2021 .
From that point, a major bear market started.
Between 7 April 2021 and 29 December 2022 , Solana remained in a clear downtrend , printing continuous lower highs and lower lows.
Price dropped from $260 to nearly $8 , resulting in a −96.9% correction , which is typical for high-beta altcoins during bear cycles.
A new bull market phase began on 30 December 2022 , but according to current market structure and cycle analysis , this bull phase has now ended around 13 September 2025 .
The overall structure has shifted bearish , and Solana is currently trading in a confirmed bear market phase starting from 14 September 2025 .
Key Resistance Zones (Strong Reversal Areas):
$148
$174
$210
These levels are expected to act as major supply zones , where strong selling pressure and reversals are likely.
Bear Market Outlook & Risk Projection
Bear market may extend until October 2026
A further downside move of up to −88% is possible within this cycle
If such a correction occurs, there is an 80% probability that SOL could trade in the $45 – $30 range during September–October 2026
Key Support Zones (Accumulation Areas):
$80
$45
$30
Trading Bias
* Avoid long positions during this phase
* Focus on short setups near resistance zones
* Trade with strict risk management and confirmation
Disclaimer:
This analysis is based on historical market cycles, structure, and technical behavior .
Not financial advice. Always manage risk.
Market insights
Solana (SOL): towards $117?Hi!
SOL remains in a clear descending channel, indicating sustained bearish momentum. After a period of consolidation within the rectangular range, the price recently rejected the upper boundary, forming a potential continuation pattern. The RSI sits near 40, signaling slight oversold conditions but no strong reversal yet. Price action suggests a likely retest of the channel’s lower boundary near $117.48, aligning with the support zone highlighted. Traders should watch for confirmation of a bounce at this level or continuation lower. Short-term pullbacks may occur, but the dominant trend remains bearish.
Conclusion: Trend-following strategy favored; bearish continuation likely, $117 support key.

SOL very Bullish , Stronger Fundamentalafter ranging for long period of time finally we enter a supercycle, after we watch fed meeting the path is clear. there is no more hawkish, there is more cuts on 2026, we also have Kevin Hassett to make sure everything will goes as Trump's plan. 165k-200k BTC is very possible , 9K-12k ETH is very possible, and 900-1200 SOL is likely the output. Keep stack and buy more. there is only one chance to see this price is only on 2025, there is no cheap BTC ETH SOL in the future. buy as much as you can on SPOT , not in futures market.
Good luck i hope to see you with more wealth in 2026

SOLUSD- SOLANA SELLS#SOLUSD I am looking for a sell opportunity if price breaks 130 and a sell continuation if 127 is broken. Target profit 112 and stops above 135

Solana Sell Now the bearich movement is strating right now n take your positions and traget the all time low , crypto is ove r

just for watchingdon't expect this to happen but is here to show odds and probabilities
10:1 4:1 or a 3:1 choice is yours but could all be wrong as the market is caught up in major chop.

TRADELINEOFMINESOLUSD is now trying to go up trend but becareful, Market makers behind this now and playing seriously with millions, always watch this move, if you do not want to lose your money, this is not the time of set it and forget it. I had 139.00 long with TP 145.00 and keep watching.

SOLANA MACRO VIEW !
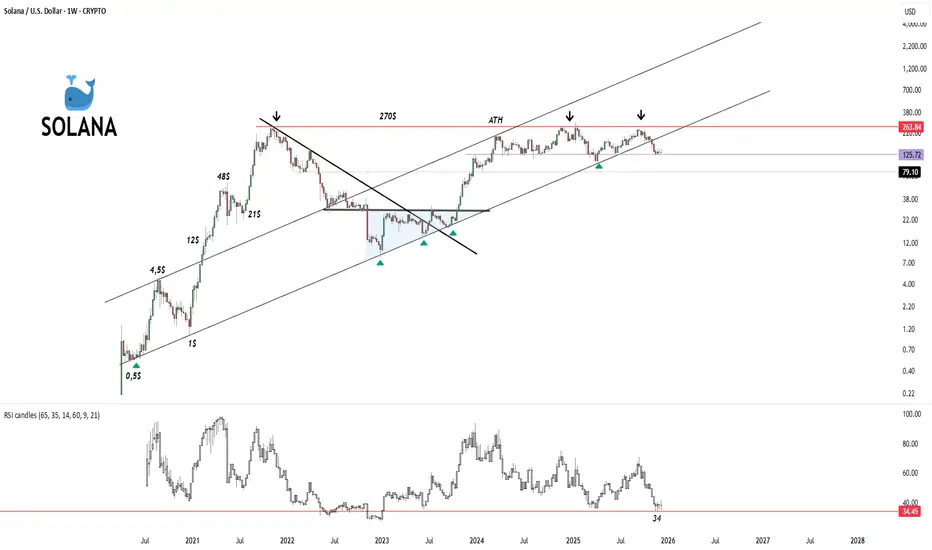
1. Macro Trend: Ascending Channel
The most dominant feature of this chart is the massive ascending parallel channel (the two long black lines sloping upwards).
Long-Term Bullish: Despite volatility, the price has generally trended upward over the last several years, respecting the boundaries of this channel.
Current Status: The price is currently in the lower half of this channel. After being rejected near the top of the channel (around the ATH region), it is retracing downward.
2. Key Support & Resistance Levels
Resistance (The Ceiling):
~$263 - $270 (Red Zone): This is the major historical resistance area, aligned with the All-Time High (ATH). The chart shows three distinct rejections (marked by black downward arrows) in this area over the last year, indicating strong selling pressure whenever SOL approaches this price.
Upper Channel Line: The diagonal upper line acts as dynamic resistance.
Support (The Floor):
~$125.72 (Purple Line): The price is currently trading at $131.50, just above this crucial horizontal support level. This level previously acted as resistance during the recovery phase; holding this line is critical for bulls.
~$79.10 (Dotted Line): If the $125 level fails, the next major historical support is around $79.
Lower Channel Line: The diagonal bottom line is the "trend defender." Every time the price has touched this line (marked by green triangles), it has bounced significantly.
3. Indicator Analysis: RSI (Relative Strength Index)
The bottom panel shows the RSI, which measures momentum.
Approaching Oversold: The RSI is currently at 34.45.
Historical Bounce Zone: The red horizontal line at 34.45 on the RSI panel suggests this is a historical "floor" for momentum. In previous instances (like late 2020 and mid-2022), when the RSI hit this low, the price eventually found a bottom and reversed upward.
Divergence: The RSI is making lower lows, confirming the strength of the current downtrend, but it is reaching a point where sellers often become exhausted.
4. Chart Patterns & Behavior
Rejection at ATH: The "Double Top" or "Triple Top" formation near the $260-$270 level is a bearish reversal pattern, which explains the significant correction SOL is currently experiencing.
Correction Phase: Since hitting the top of the channel, the price has been in a consistent downtrend (lower highs and lower lows on the weekly timeframe).
Summary
The chart depicts a critical decision point for Solana.
The Bearish Case: If the price breaks below the $125 support, it could flush down to the $80 region or the bottom of the channel to find liquidity.
The Bullish Case: The RSI hitting historical support (34) combined with the horizontal price support at $125 suggests a potential bounce area. If buyers step in here, the trend remains intact
-------------------
1. Historical "Bottom" Zone (Momentum Support)
Looking at the bottom RSI panel, whenever the RSI line touches or approaches the 34 level (the red horizontal line), we see that selling pressure tends to exhaust and buyers step in.
Past Examples: Looking at the left side of the chart (late 2020 - early 2021), when the RSI dropped to these low levels, the Solana price found a bottom (around $1) and subsequently launched a massive bullish trend.
Meaning: This level acts as a psychological floor where "bear" (seller) strength runs out and "bulls" (buyers) prepare to take over momentum.
2. Approaching Oversold Signal
RSI typically considers anything below 30 as "oversold." The 34 level is very close to this zone.
The fact that the RSI is currently at 34.45 indicates that the price has dropped sharply and quickly, and this decline is approaching an unsustainable point.
Technically, this is interpreted as a zone where it is "too late to sell, but time to look for buying opportunities."
3. Confluence of Price and RSI
The price is trading at $131.50, trying to hold the $125 support.
The fact that the RSI has hit the 34 support at this exact same moment creates a condition of "Double Support" (support in both price and momentum).
This alignment increases the probability of a reaction bounce from this area.
4. Risk Warning
While the RSI 34 level is strong support, if this level is broken to the downside (meaning RSI slides below 30 into the 20s), it indicates that the downtrend is extremely strong and panic is continuing. In this scenario, there is a risk of the price retracing to the next major support zone around $79.
In Summary: The 34 RSI level is currently a "Make or Break" decision point for Solana. Historical data suggests that this level usually marks a reversal point.
+
SOL/BTC 1w
SOL Dominance
Solana Sitting in Wholesale Zone: Here’s What the Chart ShowsA **Fibonacci retracement** from ~95 (0 level) to ~296 (1.0 level).
The major levels highlighted:
0.382 ≈ 171.87
0.618 ≈ 219.37
1.0 ≈ 296.25
1.618 ≈ 420.63
Price currently around 135–136
Region coloring:
Wholesale zone** (green, ~95–140)
Equilibrium zone** (yellow/green, ~170–220)
Retail zone** (red, ~296+)
The dotted trendline beneath price suggests long-term support rising over time.
🧠 What This Chart Appears to Communicate (Educational Interpretation)
1. **Price is currently in the “Wholesale” or Discount Zone
Visually, this means:
According to the chart’s structure, this is the lower end of the recent multi-year range.
This part of the chart is often interpreted as the “accumulation” region.
This is NOT advice, just a description of how the chart is labeled.
Equilibrium Levels Above Price (171–220 Zone)
These levels are often seen as:
Areas where previous sellers and buyers met
Places where price consolidates before choosing direction
3. Retail Zone (296+)
This is where:
Prior highs exist
Buyers in that zone historically may have been late
Higher risk of reversal historically in charts marked this way
Again, not advice, just technical labeling.
4. The 1.618 extension (≈420) marks the aggressive upside target
This is a classic Fib extension often referenced in trend-continuation models.
💡 Neutral, Educational “Trade Idea Structure” Based on the Chart
🟩 Scenario A: Range Reversion Toward Equilibrium (Educational)
If price stays above the rising trendline near ~130:
Hypothetical target zones:
First structural zone: **0.382 (~171.87)**
Secondary zone: **0.618 (~219.37)**
Reasoning (educational only):
Price often revisits equilibrium after spending time in deep discount zones.
🟧 Scenario B: Midrange to High-End Rotation (Hypothetical)
If price breaks above ~220 and holds weekly structure:
Targets shown on chart:
1.0 Fib (~296)
1.618 extension (~420)
This represents a trend-continuation idea.
🟥 Scenario C: Breakdown of Wholesale Zone
If the weekly structure fails and price falls below ~95:
Risk zone technically identified:
Price could revisit prior demand zones not shown on this chart.
This is what invalidation could look like from a purely chart-structural perspective.
Observations (No prediction)
Solana's weekly structure has made *higher lows since Oct/Nov*, which can indicate strengthening relative structure.
Price is currently sitting on trendline-like support.
The 171–220 band is a major pivot region visible on the chart.

SOL Breakdown: Still No Bull Signal Below $133SOL has been chopping sideways after the broad downtrend. Price failed to reclaim previous supply layers (~$180–$200), holding under resistance again.
Indicators:
RSI: ~43 (bearish-short term)
MACD: flat to slightly bearish, no strong bullish cross
Structure:
Lower lows still intact. No bullish MSB breakout confirmed above the recent range.
Position: Short bias
Entry Idea: Short below $133
Stop: Above $140
Targets: $120 → $110
Reasoning: Bearish continuation unless price breaks structure and flips back above the recent swing high.

$SOL Solana is currently in a clear accumulation phase following a strong reaction from the major demand zone.
The horizontal accumulation in this zone indicates both a re-intensification of liquidity and the market gathering energy for the next directional breakout.
As long as the region holds, the structure is positive, and this accumulation will be the key to the next expansion phase.

SOLANA UPDATE - H2A small yet Important update for the recent analysis.
1st, we have a Strong red resistance line stretching back to the origin of this whole big bearish leg from the Top of SEP 18. This line has been respected several times & has proven to be powerful.
That same line was retested today with clear rejection.
2nd, we have a second ascending purple channel, next to the major blue one. It is more visual in the 30mn time frame.
Also, the chart has just broken this channel.
So We have Retested blue channel 1 for the 2nd time & just broken purple channel 2.
Add to this that we have also reached Fibonacci 1 in a Potential corrective wave C.
These 4 Signals are giving the upper hand for a more downward move while we are approaching the FVG zone.
We might witness a retest of the channel 2 lower border before proceeding down.
An upward move is still valid yet getting weaker by the minute.
Safe Trade.

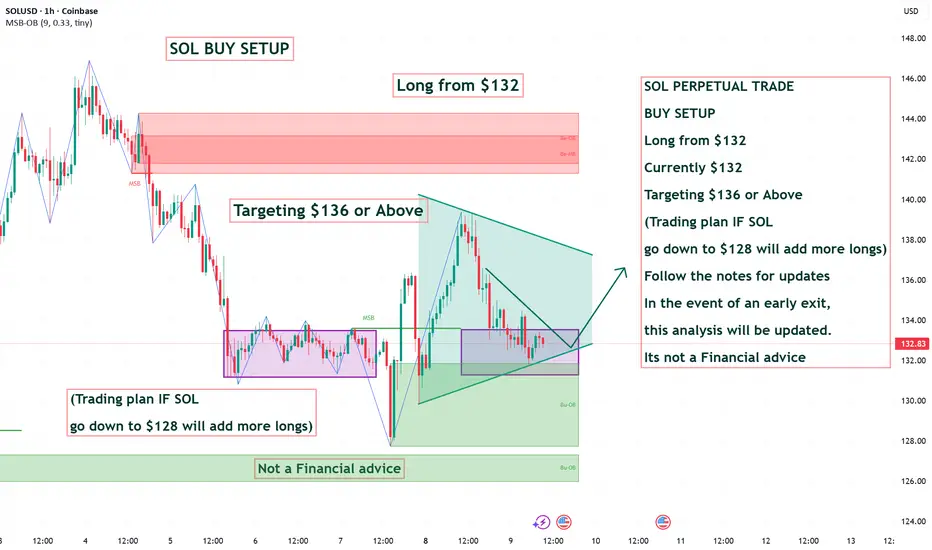
SOL PERPETUAL TRADE BUY SETUP Long from $132SOL PERPETUAL TRADE
BUY SETUP
Long from $132
Currently $132
Targeting $136 or Above
(Trading plan IF SOL
go down to $128 will add more longs)
Follow the notes for updates
In the event of an early exit,
this analysis will be updated.
Its not a Financial advice
No Clear Path yet...but I Still Favor Higher in Orange or BlackOrange represents a FLAT retracement, whereas Black represents a standard retracement. However, since we have not even traded above the 23.6%, I am still carrying a purple OML count.
Therefore, SOL is about as clear as mud.
Chris

SOL Bearish Short (momentum)we might see correction because over leveraged position on futures.
we can ride the bears, , but if the sol fail to hold the 105, it good to still hold the short until 80 USD.
cheers

Solana vs USD – Bearish Playbook High-Probability Swing Setup🔹 Asset: SOL/USD – “SOLANA VS U.S. DOLLAR”
🔹 Trade Style: Crypto Market Opportunity Blueprint (Swing Trade)
🔻 Plan: Bearish Plan
📍 Entry Zone
You can enter at any price level according to your strategy and confirmation signals.
🛑 Stop Loss (SL)
This is Thief SL → @ 152.50
Dear Ladies & Gentleman (Thief OG’s), adjust your SL based on your own strategy & risk levels.
🔔 Important:
Place SL only after breakout confirmation.
I am not recommending to use only my SL. It’s your choice — you make money, you take money at your own risk.
🎯 Target (TP)
Market has strong support + oversold conditions + potential trap zones, so kindly exit with profits.
Our Target → @ 125.00
🔔 Important:
Dear Ladies & Gentleman (Thief OG’s), I am not recommending to use only my TP.
It’s your choice — you make money, you take money at your own risk.
📊 Related Pairs to Watch (Correlation Guide)
1️⃣ BITSTAMP:BTCUSD – Bitcoin
King of crypto; SOL often follows BTC’s direction.
If BTC breaks down, SOL bearish continuation becomes stronger.
2️⃣ BITSTAMP:ETHUSD – Ethereum
High correlation with major altcoins.
ETH weakness usually signals pressure on L1 chains like SOL.
3️⃣ COINBASE:AVAXUSD – Avalanche
Competitor L1 chain; often moves in similar sentiment flow.
If AVAX also shows bearish structure → confirms broad L1 weakness.
4️⃣ COINBASE:LTCUSD – Litecoin
Old major coin; used for risk-on/risk-off sentiment checks.
If LTC dumps → market-wide bearish confirmation.
5️⃣ CRYPTOCAP:TOTAL2 – Altcoin Market Cap
Measures overall altcoin health.
If TOTAL2 breaks its support → SOL likely accelerates toward bearish target.
🔍 Why These Pairs Matter? (Key Correlation Points)
BTC sets the tone – SOL follows the major trend 75–85% of the time.
ETH determines altcoin liquidity – if ETH dominance rises, SOL loses capital flow.
AVAX acts as sector correlation – L1 competitors weaken together during bearish cycles.
TOTAL2 confirms broad alt weakness, making SOL’s downside more reliable.

Solana Rebounds Weakly with No Clear Trend SignalsSolana on the 4H timeframe is only showing a mild pullback, as neither technicals nor news indicate fresh inflows strong enough to shift momentum. Price remains capped below the 138–142 FVG resistance cluster, and although small rebounds occur, their narrow range highlights the lack of aggressive buying. The Ichimoku cloud and multiple overhead FVGs form a thick supply layer, causing every upward attempt to be sold off — making a breakout relatively unlikely.
Volume behaviour also supports the idea of a technical retracement: it picks up slightly at the lows but fades as price climbs, signalling reactive buying rather than committed inflows. If SOL fails to break above 142, a move back down to fill the lower FVG at 128–123 remains a reasonable scenario.

SOLUSD – Possible Reversal
SOL is currently sitting inside the 124.73–95.33 area. As long as the price stays above this area, the upside potential remains. A break and retest above 145 could signal continuation towards 180 and then 260. This idea becomes invalid if the price closes below 95.35.

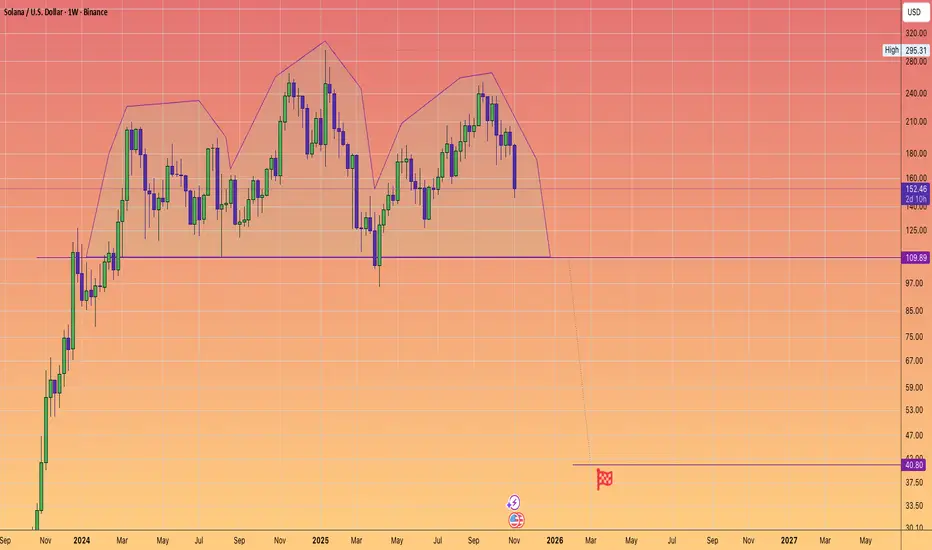
Solana could rapidly fall to $40A massive potential Head and shoulders topping exists on Solana. And many other Altcoins exhibit similar tops.
Keep nimble and protect your gains if you have them.
On the positive side, I believe the bear market will be swift and we could potentially see this number as early as next March.
Why because Solana's network effect topped on the #Trump memecoin release last January.
The solana ecosytem also enjoyed a full cycle of activity unlike other chains.
I believe there will be plenty of buyers at those prices.
SOLUSDT – Gains Limited, Price Faces a Key Decision ZoneHello everyone, SOL experienced an impressive upward move over the past weekend, but the current momentum has noticeably weakened as the price hits the EMA 89 (blue), an area that has previously created strong selling pressure last month.
After bouncing around the 145 USD mark, SOL retraced to test both EMA 34 (red) and EMA 89, forming a critical convergence zone to determine the next direction. Recent candles show long upper wicks accompanied by decreasing volume, indicating that buyers are losing strength compared to the previous breakout while profit-taking pressure is rising. The market structure has yet to confirm an uptrend, as SOL has only slightly broken local highs without forming a clear higher-high, explaining why the price was rejected at EMA 89.
From a macro and capital flow perspective, over the past 48 hours, the Solana ecosystem has shown a positive recovery, with several DeFi projects and memecoins rallying. However, capital inflows into altcoins have paused as investors await updates from the Fed and US economic data. Bitcoin is currently moving sideways, meaning the primary market momentum supporting altcoins, including SOL, is insufficient to drive a breakout. Therefore, even positive news is not yet strong enough to establish a new trend.
Wishing everyone successful trading!

BUY LOOK POSSIBLE NOW FOR SOLUSDKCFX HERE
SOLUSD INSIGHTS
We see HL(HIGHER LOW), formed criterias met, we shud see price push higher, we open a BUY HERE and target TP1
When Edge opens up we take sharp
LETS GO...
TRUST THE SYSTEM
🍏✨🍏

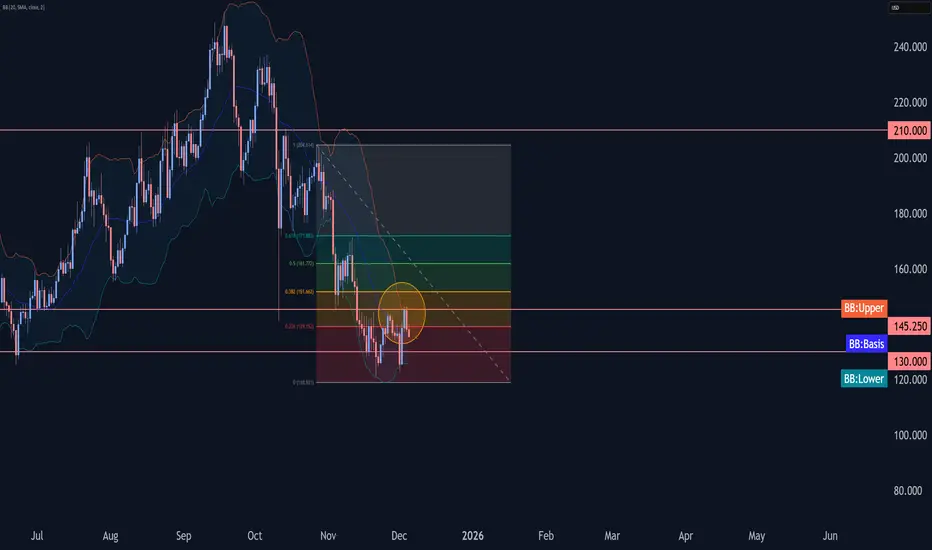
Solana Wave Analysis – 5 December 2025
- Solana reversed from resistance zone
- Likely to fall to support level 130.00
Solana cryptocurrency pair recently reversed down from the resistance zone between the resistance level 145.25 (former strong support from October and November) and the upper daily Bollinger Band.
This resistance zone was strengthened by the 50% Fibonacci correction of the downward impulse from November.
Solana cryptocurrency can be expected to fall to the next support level 130.00 (which has been steadily reversing the price from June).
SOLUSD: Breakout from Bottom Structure Inside Downtrend ChannelHi!
SOL has been trading inside a descending channel, consistently respecting both upper and lower boundaries. Recently, price formed a clear Inverse Head & Shoulders at the bottom of the channel, signaling potential bullish reversal momentum. The neckline breakout aligns with the break of the minor descending trendline, strengthening the shift in structure.
If price holds above the neckline, the pattern projects a move toward the 160–165 USD zone, which also aligns with the channel’s upper boundary, a strong confluence area and natural target for bulls.
However, failure to sustain above the neckline could lead to a pullback toward the right-shoulder region, though the setup remains valid as long as price stays above the head level.
Overall, SOL is showing a bullish reversal signal, with upside continuation favored while above the breakout zone.
