SOL in descending channel ready for jump 28% gain toward 170$Hi the support and resistances on the chart are based on the previous data and weekly candlesticks if BINANCE:SOLUSDT holds this last support the potential of 28% gain is logical toward 170$
Related pairs

Lingrid | SOLUSDT Initial Major Resistance Zone After Price DropBINANCE:SOLUSDT is climbing toward the 150–155 resistance cluster, where the downward channel’s trendline, horizontal supply, and the local upward trendline all converge. Despite the recent bounce, the broader structure remains bearish, with multiple lower highs and no confirmed reversal—suggesting

SOLUSDT Relief Rally into Supply Big Move ComingSOLUSDT has been grinding through a deep corrective phase since the January 2025 ATH. Wave A established the base, and price action is now developing the final leg of the structure. If the pattern completes fully, the extension could stretch toward the $80 zone before true recovery begins.
For now,

SOLANA: Bullish Breakout Awaits Above 145SOLANA: Bullish Breakout Awaits Above 145
Solana is currently testing the upper boundary of its range-trading structure. A clean breakout above the 145 level would significantly increase the probability of a sustained bullish continuation.
For now, the price is still developing inside the pattern

DeGRAM | SOLUSD is preparing to reach the $160 level📊 Technical Analysis
● SOL rebounded sharply from the major support zone near 130, breaking the inner falling channel and signaling a shift in short-term structure. Price is now forming a bullish continuation pattern beneath dynamic resistance, with room to extend toward the 160 level once the bre

$sol shortSOL failed to break structure to the upside and instead delivered a clean retracement into premium, rejecting right at the supply zone + Alligator alignment.
This is classic continuation orderflow.
1️⃣ Premium Retracement Complete
Price traded up into the bearish supply block (green zone)
aligne

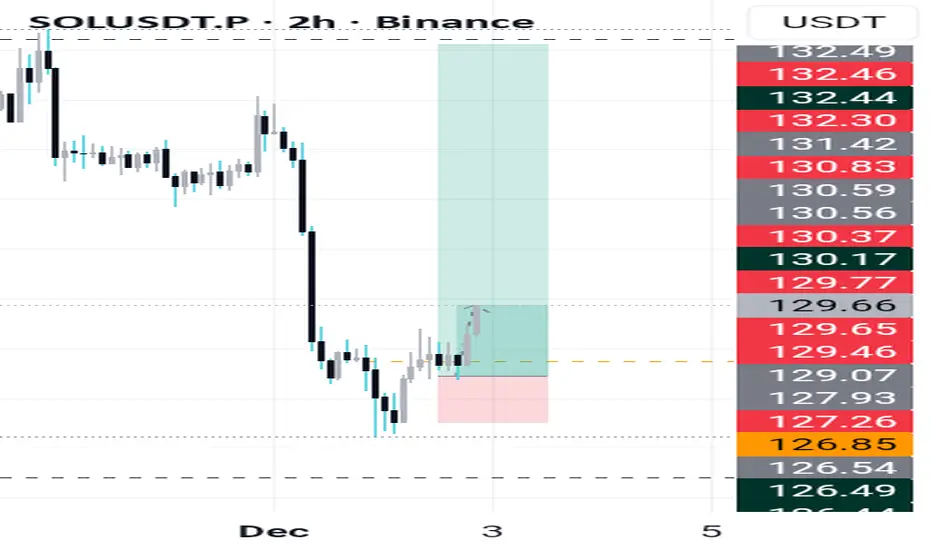
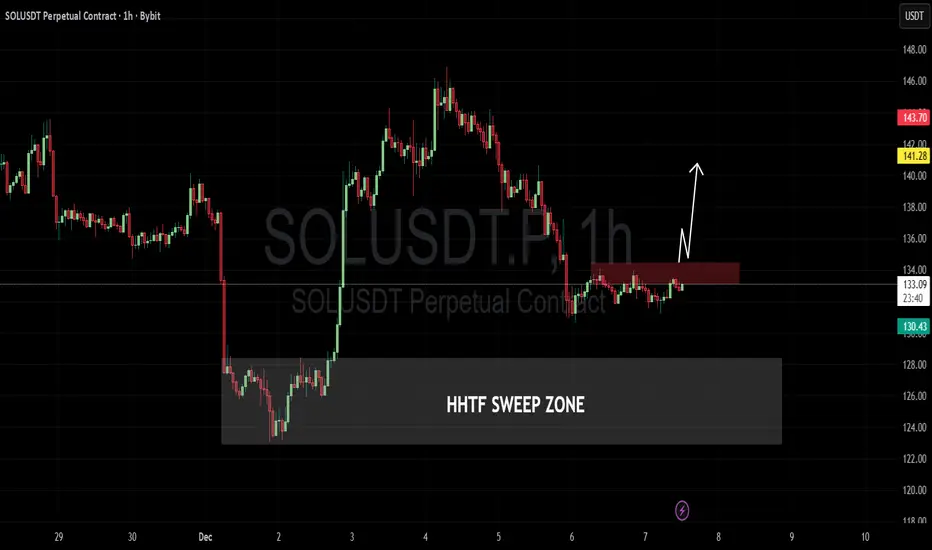
When sol does sol pumps ?The Plan:
Breakout: The price needs to close a 1-hour candle strongly above the Red Box (above ~134.50) to confirm that buyers have absorbed the selling pressure.
Retest (Flip): Ideally, price pulls back slightly to turn the previous resistance (Red Box) into support.
Expansion: Price continues u
SOL-USDTIt was expected to have a correction after the growth it had, and now it is on its static support at $130 🕯📊
If it can maintain this level, the price could rotate and bounce back upwards 🚀💰
In case the correction continues, the next level will be at $124 ✔️🔼

SOL Confirms Bearish PatternSOL Confirms Bearish Pattern
On Friday, Solana confirmed a larger bearish pattern following Trump’s comments.
So far, the pattern remains valid, showing signs of a larger decline. Whether that happens remains to be seen in the coming days or weeks.
But given that BTC has started to correct furt

See all ideas
Summarizing what the indicators are suggesting.
Oscillators
Neutral
SellBuy
Strong sellStrong buy
Strong sellSellNeutralBuyStrong buy
Oscillators
Neutral
SellBuy
Strong sellStrong buy
Strong sellSellNeutralBuyStrong buy
Summary
Neutral
SellBuy
Strong sellStrong buy
Strong sellSellNeutralBuyStrong buy
Summary
Neutral
SellBuy
Strong sellStrong buy
Strong sellSellNeutralBuyStrong buy
Summary
Neutral
SellBuy
Strong sellStrong buy
Strong sellSellNeutralBuyStrong buy
Moving Averages
Neutral
SellBuy
Strong sellStrong buy
Strong sellSellNeutralBuyStrong buy
Moving Averages
Neutral
SellBuy
Strong sellStrong buy
Strong sellSellNeutralBuyStrong buy
Displays a symbol's price movements over previous years to identify recurring trends.
Frequently Asked Questions
The current price of SOL / TetherUS (SOL) is 138.25 USDT — it has risen 4.72% in the past 24 hours. Try placing this info into the context by checking out what coins are also gaining and losing at the moment and seeing SOL price chart.
SOL / TetherUS price has risen by 3.75% over the last week, its month performance shows a −14.41% decrease, and as for the last year, SOL / TetherUS has decreased by −41.95%. See more dynamics on SOL price chart.
Keep track of coins' changes with our Crypto Coins Heatmap.
Keep track of coins' changes with our Crypto Coins Heatmap.
SOL / TetherUS (SOL) reached its highest price on Jan 19, 2025 — it amounted to 295.83 USDT. Find more insights on the SOL price chart.
See the list of crypto gainers and choose what best fits your strategy.
See the list of crypto gainers and choose what best fits your strategy.
SOL / TetherUS (SOL) reached the lowest price of 1.03 USDT on Dec 23, 2020. View more SOL / TetherUS dynamics on the price chart.
See the list of crypto losers to find unexpected opportunities.
See the list of crypto losers to find unexpected opportunities.
The safest choice when buying SOL is to go to a well-known crypto exchange. Some of the popular names are Binance, Coinbase, Kraken. But you'll have to find a reliable broker and create an account first. You can trade SOL right from TradingView charts — just choose a broker and connect to your account.
Crypto markets are famous for their volatility, so one should study all the available stats before adding crypto assets to their portfolio. Very often it's technical analysis that comes in handy. We prepared technical ratings for SOL / TetherUS (SOL): today its technical analysis shows the neutral signal, and according to the 1 week rating SOL shows the sell signal. And you'd better dig deeper and study 1 month rating too — it's sell. Find inspiration in SOL / TetherUS trading ideas and keep track of what's moving crypto markets with our crypto news feed.
SOL / TetherUS (SOL) is just as reliable as any other crypto asset — this corner of the world market is highly volatile. Today, for instance, SOL / TetherUS is estimated as 5.96% volatile. The only thing it means is that you must prepare and examine all available information before making a decision. And if you're not sure about SOL / TetherUS, you can find more inspiration in our curated watchlists.
You can discuss SOL / TetherUS (SOL) with other users in our public chats, Minds or in the comments to Ideas.